
Equity · Technology
Applied Optoelectronics, Inc. (AAOI) perpetual futures
AAOI perpetual futures on 24 crypto exchanges – live perp price vs the stock, funding rate, open interest and where to trade AAOIUSDT.
Applied Optoelectronics, Inc. designs and makes fiber-optic networking products, including optical modules and transceivers, for data centers, cable TV, and telecom equipment makers.
Price chart
Use the left and right arrow keys to inspect points on the chart.
Trading data
Perpetual market activity
25/25 live markets
Trading data
Perpetual market activity
Spot performance
Venue matrix
25 markets
Some venue links are sponsored. We may receive a commission, and eligible users may occasionally receive trading-fee discounts, at no additional cost to you.
| Trade | ||||||||||||
|---|---|---|---|---|---|---|---|---|---|---|---|---|
 Binance | Trade | AAOI/USDT | Trading | $48.28 | 0.0% APR 0.000% every 8h | +2.1 bps | $621.7K | $6.5M | $11.9M | USDT | - | |
 Gate.io | Trade | AAOI/USDT | Trading | $48.29 | 0.0% APR 0.000% every 8h | +4.1 bps | $2.2M | $2.4M | $1.7M | USDT | 50x | |
 OKX | Trade | AAOI/USDT | Trading | $48.24 | 0.0% APR 0.000% every 8h | +2.1 bps | $509.3K | $2.2M | $4.1M | USDT | 20x | |
 KuCoin | Trade | AAOI/USDT | Trading | $48.30 | 0.0% APR 0.000% every 8h | +14.5 bps | $26.3K | $1.1M | $290.5K | USDT | 20x | |
 Bybit | Trade | AAOI/USDT | Trading | $48.25 | 0.0% APR 0.000% every 8h | +6.2 bps | $145.5K | $627.9K | $1.6M | USDT | 25x | |
 Bitunix | Trade | AAOI/USDT | Trading | $48.27 | +4.6% APR +0.00419% every 8h | +2.1 bps | $1.5M | $442.8K | $153.9K | USDT | 20x | |
 Hyperliquid HIP-3 | Trade | xyz:AAOI | Trading | $48.23 | -159.5% APR -0.018% every 1h | +11.4 bps | - | $306.7K | $1.9M | USDC | 10x | |
 MEXC | Trade | AAOI/USDT | Trading | $48.28 | 0.0% APR 0.000% every 8h | +2.1 bps | $1.8M | $171.8K | $561.7K | USDT | 50x | |
| Hyperliquid HIP-3 | Trade | para:AAOI | Trading | $48.17 | -265.1% APR -0.030% every 1h | +56.9 bps | $72.3K | $116.3K | $179.2K | USDC | 10x | |
 Variational | Trade | AAOI/USDC | Trading | $48.28 | 0.0% APR 0.000% every 8h | +9.0 bps | no public depth feed | $59K | $53.3K | USDC | - | |
 BloFin | Trade | AAOI/USDT | Trading | $48.27 | -0.6% APR -0.00051% every 8h | +6.2 bps | $417.9K | $36.3K | $275.1K | USDT | 20x | |
 Deribit | Trade | AAOI/USDC | Trading | $48.24 | -1.4% APR -0.00129% every 8h | +6.2 bps | $181.8K | $4.3K | $2.6K | USDC | 10x | |
 GRVT | Trade | AAOI/USDT | Trading | $48.28 | 0.0% APR 0.000% every 8h | +6.2 bps | $246.1K | $2.2K | $169 | USDT | - | |
 HTX | Trade | AAOI/USDT | Trading | $48.24 | 0.0% APR 0.000% every 8h | +33.2 bps | $13.3M | $1.6K | $10.1K | USDT | - | |
 Aster | Trade | AAOIUSDT | Trading | $48.37 | 0.0% APR 0.000% every 8h | +89.1 bps | $129.4K | $1.1K | $9.5K | USDT | - | |
 Orderly Network | Trade | AAOI/USDC | Trading | $48.28 | +8.1% APR +0.00736% every 8h | - | no public depth feed | $266 | $3.3K | USDC | - | |
 Aevo | Trade | AAOI/USDC | Trading | $48.26 | +11.4% APR +0.00130% every 1h | +19.1 bps | $205K | $0 | $0 | USDC | 10x | |
 Crypto.com Exchange | Trade | AAOI/USD | Trading | $48.30 | +5.0% APR +0.00057% every 1h | +20.7 bps | $15.4K | $0 | $2.2K | USD | 50x | |
 Extended | Trade | AAOI/USD | Trading | $48.25 | 0.0% APR 0.000% every 1h | +5.0 bps | - | $0 | $4.3K | USD | 10x | |
 XT.com | Trade | AAOI/USDT | Trading | $48.29 | 0.0% APR 0.000% every 8h | +10.4 bps | $73.6K | $970.2K | - | USDT | 20x | |
 Bitget | Trade | AAOI/USDT | Trading | $48.28 | 0.0% APR 0.000% every 8h | +2.1 bps | $1.8M | $17.8M⚠ | $2.5M | USDT | 20x | |
 LBank | Trade | AAOI/USDT | Trading | $48.28 | 0.0% APR 0.000% every 8h | +2.1 bps | $1.3M | $1.9M⚠ | $68.8K | USDT | 50x | |
 Deepcoin | Trade | AAOI/USDT | Trading | $48.22 | +88.0% APR +0.080% every 8h | +2.1 bps | $309.8K | $1.8M⚠ | $1.1K | USDT | 25x | |
 BingX | Trade | AAOI-USDT | Trading | $48.28 | +5.5% APR +0.00500% every 8h | +4.1 bps | $982.4K | $1.6M⚠ | $444.8 | USDT | - | |
 Ourbit | Trade | AAOI/USDT | Trading | $48.27 | 0.0% APR 0.000% every 8h | +2.1 bps | $1.7M | $1M⚠ | $135.9K | USDT | 50x |
Unverified volume: implausibly high against open interest, a typical sign of wash trading. These venues are listed last.
Tokenized wrappers of the real stock, tradable on-chain and on crypto exchanges around the clock. Premium/discount compares the token price to our stock reference price. Data: CoinMarketCap · Robinhood · DexScreener · GeckoTerminal.
| Product | Price | Premium vs stock | 24h Vol. | Market Cap | Chains |
|---|---|---|---|---|---|
| AAOIBbStocks | $48.16 | -0.17% | $2.6M | $6.1M | BNB Smart Chain (BEP20) |
| rAAOITokenized | $48.00 | -0.50% | $75k | $496k | Arbitrum |
| AAOIRobinhood | – | – | – | $10k | Robinhood Chain |
Tradability
Execution quality
Entry cost and depth per venue at $1k–$100k
Tradability
Execution quality
Entry cost and depth per venue at $1k–$100kBroad liquidity · 20 of 24 venues absorb $10k · Typical cost: +8.2 bps – +22.4 bps
Too thin: Crypto.com Exchange
No fresh book data: Variational, Orderly Network, Extended
Taker execution estimate incl. approx. fees - maker fills are not guaranteed.
Best venues for this underlying
Best liquidity
AAOITightest spread
AAOIHighest volume
AAOIFunding history
Stored venue snapshots by market
Funding history
Stored venue snapshots by marketNext catalyst
Catalysts
Next catalyst
Catalysts
No unusual perp activity right now.
Research data
Analysts, filings and peer context
Research data
Analysts, filings and peer context
Estimates
6Company events
6Peer comparison
Similar listed perpsRevenue mix
Latest annualAnalysts
Price targets in USD| Consensus rating | Buy |
|---|---|
| Average 12-month price target | $139 |
| 12-month target range (low – high) | $100 – $178 |
| Ratings in the provider's consensus | 16 |
Price targets as of 2026-11-15
Analyst rating history
Ratings| Month | Strong buy | Buy | Hold | Sell | Strong sell |
|---|---|---|---|---|---|
| Nov 2026 | 2 | 2 | 3 | 0 | 0 |
| Oct 2026 | 2 | 1 | 3 | 0 | 0 |
| Sep 2026 | 2 | 1 | 3 | 0 | 0 |
| Aug 2026 | 2 | 1 | 3 | 0 | 0 |
| Jul 2026 | 2 | 1 | 3 | 0 | 0 |
| Jun 2026 | 2 | 1 | 3 | 0 | 0 |
| May 2026 | 2 | 1 | 3 | 0 | 0 |
| Apr 2026 | 2 | 1 | 3 | 0 | 0 |
| Mar 2026 | 2 | 1 | 3 | 0 | 0 |
| Feb 2026 | 2 | 2 | 3 | 1 | 0 |
| Jan 2026 | 2 | 2 | 1 | 1 | 0 |
| Dec 2025 | 2 | 2 | 1 | 1 | 0 |
Ownership
Institutional · 2026-Q3Reference market activity
AAOI-PERPPrice performance
11Insider activity
FY2026 Q4Insider transactions
25On Nov 10, 2026, CFO Murry Stefan J. sold 4,000 shares of Applied Optoelectronics common stock at $48.83 per share, leaving 353,223 shares owned after the transaction.
CFO Murry Stefan J. reported disposing of 5,945 shares of Applied Optoelectronics common stock at $77.32 each across 4 F-Tax withholding transactions on 2026-10-22, leaving 357,223 shares owned.
Officer Chang Hung-Lun (Fred) reported 5,141 shares of Applied Optoelectronics common stock disposed at $77.32 per share in four F-InKind (tax withholding) transactions on 2026-10-22, leaving 244,135 shares owned.
CEO Lin Chih-Hsiang disposed 16,673 shares of Applied Optoelectronics common stock at $77.32 per share in four F-InKind tax-withholding transactions on 2026-10-22, leaving 1,279,374 shares owned.
Officer Yeh Shu-Hua (Joshua) reported 4 F-InKind transactions totaling 2,218 common shares withheld for taxes at $77.32 per share on 2026-10-22, leaving 369,280 shares owned.
Applied Optoelectronics officer Kuo David C reported 4 F-InKind tax-withholding disposals totaling 3,586 common shares at $77.32 each on 2026-10-22, leaving 142,228 shares owned.
Applied Optoelectronics CFO Murry Stefan J. sold 4,000 shares of common stock at $102.87 apiece on Oct 12, 2026, leaving 363,168 shares owned. Form 4 filed Oct 14, 2026.
Applied Optoelectronics (AAOI) officer Yeh Shu-Hua (Joshua) sold 6,000 common shares on 2026-10-05 at $120.03 each, leaving 371,498 shares owned.
Director Richard B. Black gifted 2,200 shares of Applied Optoelectronics common stock on 2026-09-15, leaving 159,092 shares owned.
Applied Optoelectronics officer Chang Hung-Lun (Fred) sold 32,172 common shares at $110.21 on Sept 8, 2026, leaving 249,276 shares held directly.
Filings
67 · Latest SEC filingsOn Nov 10, 2026, CFO Murry Stefan J. sold 4,000 shares of Applied Optoelectronics common stock at $48.83 per share, leaving 353,223 shares owned after the transaction.
Officer Yeh Shu-Hua (Joshua) reported 4 F-InKind transactions totaling 2,218 common shares withheld for taxes at $77.32 per share on 2026-10-22, leaving 369,280 shares owned.
CFO Murry Stefan J. reported disposing of 5,945 shares of Applied Optoelectronics common stock at $77.32 each across 4 F-Tax withholding transactions on 2026-10-22, leaving 357,223 shares owned.
Applied Optoelectronics officer Kuo David C reported 4 F-InKind tax-withholding disposals totaling 3,586 common shares at $77.32 each on 2026-10-22, leaving 142,228 shares owned.
CEO Lin Chih-Hsiang disposed 16,673 shares of Applied Optoelectronics common stock at $77.32 per share in four F-InKind tax-withholding transactions on 2026-10-22, leaving 1,279,374 shares owned.
Officer Chang Hung-Lun (Fred) reported 5,141 shares of Applied Optoelectronics common stock disposed at $77.32 per share in four F-InKind (tax withholding) transactions on 2026-10-22, leaving 244,135 shares owned.
Applied Optoelectronics CFO Murry Stefan J. sold 4,000 shares of common stock at $102.87 apiece on Oct 12, 2026, leaving 363,168 shares owned. Form 4 filed Oct 14, 2026.
Applied Optoelectronics (AAOI) officer Yeh Shu-Hua (Joshua) sold 6,000 common shares on 2026-10-05 at $120.03 each, leaving 371,498 shares owned.
Director Richard B. Black gifted 2,200 shares of Applied Optoelectronics common stock on 2026-09-15, leaving 159,092 shares owned.
Applied Optoelectronics officer Chang Hung-Lun (Fred) sold 32,172 common shares at $110.21 on Sept 8, 2026, leaving 249,276 shares held directly.
Applied Optoelectronics CFO Stefan J. Murry sold 4,000 common shares at $105.33 on 2026-09-10, leaving 367,168 shares owned.
On 2026-08-18, officer Yeh Shu-Hua (Joshua) sold 6,000 common shares at $147.73, reducing holdings to 377,498 shares.
On August 10, 2026, CFO Stefan J. Murry sold 4,000 common shares of Applied Optoelectronics at $144.79 each, retaining 371,168 shares.
President and CEO Lin Chih-Hsiang (Thompson) received a grant of 9,251 shares of common stock on 2026-07-31, not an open-market purchase. He now owns 1,296,047 shares.
Joshua Yeh Shu-Hua, an officer at Applied Optoelectronics, sold 4,715 shares of common stock at $126.50 per share, leaving 383,498 shares owned afterward.
Applied Optoelectronics officer Yeh Shu-Hua (Joshua) reported a sale of 1,285 common shares at $120.02 on 2026-07-21 and 4,709 shares withheld for tax (F-InKind) at $119.26 on 2026-07-22, leaving 388,213 shares owned.
President and CEO Lin Chih-Hsiang had 15,640 shares of common stock withheld to cover taxes at $119.26 per share, across 4 transactions on 2026-07-22, leaving 1,286,796 shares owned afterward.
Fred Chang Hung-Lun had 4,676 shares of AAOI common stock withheld to cover taxes at $119.26 per share across 4 transactions, leaving 280,064 shares owned afterward.
David Kuo had 3,264 shares of Applied Optoelectronics common stock withheld to cover taxes at $119.26 per share, across 4 transactions on 2026-07-22, leaving 145,814 shares owned afterward.
CFO Stefan J. Murry had 5,408 shares of common stock withheld to cover taxes at $119.26 per share on 2026-07-22, across 4 related transactions. This was not an open-market purchase or sale; he retained 375,168 shares afterward.
CFO Stefan J. Murry sold 4,000 shares of AAOI common stock on the open market at $122.09 per share, leaving 380,576 shares owned afterward.
Joshua Yeh, an officer at Applied Optoelectronics, sold 6,000 shares of common stock at $171.89 per share on 2026-06-18. After the sale, he owned 394,207 shares.
Fred Chang Hung-Lun, an officer of Applied Optoelectronics, sold 40,329 shares of common stock at $170.60 per share on 2026-06-17, leaving 286,124 shares owned afterward.
On 2026-06-12, Chang Hung-Lun (Fred) had 27,297 shares withheld for taxes at $172.78 and sold 34,000 shares on the open market at $166.53, leaving 326,453 shares owned afterward.
On 2026-06-12, David C. Kuo had 19,065 shares withheld for taxes at $172.78 and sold 29,227 shares on the open market at $166.53, leaving 149,078 shares owned afterward.
On 2026-06-12, Yeh Shu-Hua (Joshua) had 23,397 shares withheld for taxes at $172.78 and sold 28,826 shares at $166.53, leaving 400,207 shares owned afterward.
On 2026-06-12, President and CEO Lin Chih-Hsiang (Thompson) had 86,655 shares withheld to cover taxes at $172.78 and sold 59,000 shares on the open market at $166.53, leaving 1,302,436 shares owned afterward.
CFO Murry Stefan J. had 30,330 shares withheld for taxes at $172.78 and separately sold 33,000 shares on the open market at $166.53. Total holdings after these transactions: 384,576 shares.
AAOI CFO Stefan J. Murry sold 4,000 shares of common stock at $171.45 on 2026-06-10, leaving 447,906 shares owned afterward.
Director Lin Che-Wei was awarded 1,166 shares of AAOI common stock as compensation on 2026-06-09, bringing total holdings to 254,672 shares.
Director Robert James Flanagan was awarded 1,166 shares of common stock as compensation on 2026-06-09, bringing his ownership to 1,166 shares. This was a grant, not a purchase, and no cash was paid.
Director Cynthia DeLaney received a grant of 1,166 shares of Applied Optoelectronics common stock on 2026-06-09, bringing her total ownership to 60,813 shares.
Robert James Flanagan, director, filed an initial ownership statement (Form 3) reporting no shares of common stock beneficially owned as of 2026-06-04.
Director Chen Min-Chu (Mike) was awarded 1,166 shares of Applied Optoelectronics common stock as compensation on 2026-06-09, bringing his total holdings to 162,219 shares.
Director Richard B. Black received a grant of 1,166 shares of common stock (A-Award) on 2026-06-09, bringing his total holdings to 165,529 shares.
AAOI director William H. Yeh was granted 1,166 shares of common stock (A-Award) on 2026-06-09, bringing his total ownership to 239,985 shares. This was compensation, not an open-market purchase.
Fred Chang Hung-Lun, an officer at Applied Optoelectronics, sold 4,000 shares of common stock at $200.07 per share on 2026-06-05, leaving 387,750 shares owned afterward.
Joshua Yeh Shu-Hua, an officer of Applied Optoelectronics, sold 10,000 common shares in two trades on 2026-06-04 at prices between $204.75 and $205.39, leaving 452,430 shares owned afterward.
Transcripts
Earnings callsFY2026 Q12026-05-07
Earnings calls
AI summary
positiveAAOI reported Q1 revenue of $151.1M (in-line with guidance), marking the fourth consecutive record quarter, driven by robust data center and CATV demand. The company completed first volume shipments of 800G transceivers and received first volume order for 1.6T products from major hyperscale customers. Management raised 2026 revenue guidance from $1.0B to over $1.1B, reflecting aggressive capacity expansion in Texas and Asia to meet unprecedented AI infrastructure demand.
Key takeaways
- Q1 revenue $151.1M (+51% YoY, +13% QoQ); non-GAAP gross margin 29.2%; non-GAAP loss per share $0.07
- Data center revenue $81.4M (+154% YoY); 800G revenue $4.6M (5.6% of data center); expect 60-80% growth Q3 and Q4
- Expanded manufacturing footprint to ~900K sq ft in Texas; expect 650K+ units/month 800G/1.6T capacity by end-2026, growing to 930K+ units/month by end-2027
- Expected $471M monthly data center transceiver revenue by mid-2027 (100G/400G/800G/1.6T combined); CATV revenue expected to exceed $325M annually
- Planning 350% laser fabrication capacity expansion by 2027 to support ELSFP/CPO demand; multiple long-term agreements with ~3 customers for lasers and modules
Financial highlights
- Q1 revenue $151.1M (54% data products, 44% CATV, 2% other); data center +154% YoY
- Non-GAAP gross margin 29.2%; Q2 expected 29-30%; targeting 35% by end-2026, 40%+ by Q3-Q4 2027
- Q1 cash position $449.4M vs. $216M end-2025; inventory $206.2M; Q1 CapEx $68.7M with expectations for higher quarterly CapEx going forward
- Q2 revenue guidance $180-198M; non-GAAP net income ($2.5M) to $2.8M; non-GAAP EPS ($0.03) to $0.03
Guidance
- FY2026 revenue over $1.1B with non-GAAP operating income over $140M (raised from prior guidance)
- Q2 FY2026 revenue $180-198M; non-GAAP gross margin 29-30%; non-GAAP EPS ($0.03) to $0.03
- 800G expected to ramp significantly in Q2; expect nearly 4x Q1 shipment quantities; 1.6T to begin contributing revenue in Q3, larger ramp in 2027
- CATV revenue expected $75-80M in Q2; annual CATV revenue expected to exceed $325M
Q&A themes
- Capacity expansion risk is lower due to in-house developed equipment, prior successful Asian expansions, and highly automated processes requiring minimal new labor
- ELSFP/CPO business working with ~3 large customers under 3-year long-term agreements; laser power requirements 300-400mW vs 70-100mW for transceivers; substrate supply secure with 4-5 suppliers, ~1 year inventory on hand
- 800G qualification with new hyperscale customer expected to begin shipping volume in Q2; another long-qualified customer ramping 800G this month/quarter
- Indium phosphide laser capacity shortage industry-wide; AAOI targeting top-3 global laser producer status by end-2027; 1.6T orders to be completed in 2026 but larger 2027 ramp ($1.6B+ revenue expected); competitive dynamics with contract manufacturers entering transceiver business; laser supply remains primary constraint for competitors
Risks
- Direct tariff impact of $1.4M in Q1; anticipated refund of $5.7M pending approval with uncertain recovery timeline
- Revenue growth limited by production capacity and supply chain through mid-2027, not market demand; material supply risk being actively managed with suppliers
- New equipment qualification and manufacturing ramp requires 5-7 months in Asia, 7-9 months in U.S.; customer on-site audits and additional qualifications add further timing uncertainty
FY2025 Q42026-02-26
Earnings calls
AI summary
positiveAAOI delivered record Q4 2025 revenue of $134.3M in line with guidance, with data center revenue up 69% YoY and CATV nearly tripling to $245M annually. The company expects over $1B revenue in 2026 and non-GAAP operating profit exceeding $120M, limited primarily by manufacturing capacity and supply chain rather than demand. Management projects 800G products will dominate revenue beginning Q2 2026 after firmware optimization completion in March.
Key takeaways
- Record FY2025 revenue of $456M (+83% YoY); data center revenue $196M (+32%), CATV revenue $245M (+tripled)
- Q4 non-GAAP gross margin 31.4% exceeded guidance; company achieved non-GAAP EPS of -$0.01 vs. guidance of -$0.13 to -$0.04
- 800G firmware optimization expected complete in March 2026; 800G volume ramp anticipated to begin Q2 with over $25M expected, potentially $30-40M if capacity allowed
- Capacity target: 100,000 units/month 800G at year-end 2025 (90,000 achieved); 500,000 units/month 800G and 1.6T combined by end of 2026, ~25% from Texas
- 2026 guidance: $1B+ revenue with $120M+ non-GAAP operating profit; Q1 2026 revenue expected $150-165M with non-GAAP gross margin 29-31%
Financial highlights
- FY2025 total revenue $456M (+83% YoY); Q4 revenue $134.3M (+34% YoY, +13% QoQ)
- Q4 data center revenue $74.9M (+69% YoY); CATV revenue $54M (+3% YoY, -24% QoQ); 100G products +54% YoY, 400G products +141% YoY
- Q4 non-GAAP gross margin 31.4% above guidance range of 29-31%; non-GAAP net loss $0.6M (-$0.01 per share) vs. guidance loss of $9-2.8M
- Cash position $216M at Q4 2025; total debt (excl. convertible) $67.3M; inventory $183.1M; Q4 CapEx $84M; FY2025 total CapEx $209M
Guidance
- Q1 2026 revenue guidance $150-165M; non-GAAP gross margin 29-31%; non-GAAP net loss $7M to -$300K (-$0.09 to breakeven per share)
- FY2026 revenue expected over $1B with non-GAAP operating profit exceeding $120M, limited by capacity not demand
- By mid-2027: 100G/400G revenue ~$90M monthly, 800G ~$217M monthly, 1.6T ~$71M monthly = $378M monthly transceiver revenue
- Expect sustainable non-GAAP profitability beginning Q2 2026; long-term gross margin target ~40% achievable by Q3-Q4 2027
Q&A themes
- 800G firmware optimization for multi-platform interoperability expected complete by mid-March 2026; near-term orders of $100M+ for 800G and $200M+ for 1.6T anticipated within 2-3 months
- Tariff impact Q4 2025: $1.2M direct impact on income statement, $3.1M on capital equipment; potential recovery of ~$7-8M from IEEPA tariffs; <10% of 800G/1.6T component value sourced from China with path to near-zero
- Cable TV demand driven by DOCSIS 4.0 upgrades with largest customer receiving significant 1.8 GHz amplifier volumes; new MSO customers emerging; potential $300M annual cable revenue feasible if momentum continues
- Three hyperscale data center customers expected to each represent >10% of revenue in 2026; 800G and 1.6T revenue dominated by 2-3 comparable-sized hyperscale customers
Risks
- 800G and 1.6T revenue dependent on firmware interoperability completion in March 2026 and ongoing customer qualifications; supply chain and manufacturing capacity constraints limit revenue potential despite higher demand
- Tariff policy uncertainty; while <10% of 800G/1.6T component value currently from China, potential changes to tariff rates and equipment import mix could materially impact results
FY2025 Q32025-11-06
Earnings calls
AI summary
positiveAOI achieved highest quarterly revenue in company history at $118.6 million, up 82% year-over-year and 15% sequentially, driven by record CATV revenue of $70.6 million. Datacenter revenue was impacted by approximately $6.6 million in 400G shipments delayed to Q4 due to customer receiving system timing issues. The company expects Q4 revenue between $125-140 million with meaningful 800G shipments beginning and 400G continuing to grow.
Key takeaways
- Record Q3 revenue of $118.6 million with CATV segment achieving $70.6 million (record), up 26% sequentially and over 3x year-over-year driven by 1.8GHz amplifier demand
- Datacenter revenue $43.9 million, down 2% sequentially primarily due to $6.6 million in 400G delayed shipments from new hyperscale customer that converted to Q4 revenue
- 800G product qualifications expected imminently with meaningful Q4 shipments anticipated; company expects ~100,000 units per month 800G/1.6T capacity by end of year
- 400G approaching run-rate business with capacity targeting 60,000 units per month in Q4, scaling to 110,000-120,000 by Q2 2026
- CATV guidance for Q4 of $50-55 million reflects moderation from strong Q3; company maintains $300 million+ CATV revenue target for 2026 including new software and products
Financial highlights
- Q3 revenue $118.6 million (guided $115-127 million), up 82% YoY and 15% sequentially
- Non-GAAP gross margin 31% (guided 29.5-31%), up from 25% in Q3 2024
- Non-GAAP net loss per share $0.09 (guided loss of $0.10 to loss of $0.03)
- CATV revenue $70.6 million (60% of total), Datacenter $43.9 million (37% of total), with 83% of datacenter from 100G products
Guidance
- Q4 2025 revenue guidance $125-140 million implying datacenter growth of $25-40 million offset by CATV moderation to $50-55 million
- Q4 non-GAAP gross margin 29-31%; non-GAAP loss per share $(0.13) to $(0.04) on 70.3 million weighted average basic shares
- 800G capacity target of approximately 100,000 units per month by end of 2025 and 35,000 units per month production capacity (35% of overall capacity)
- 400G capacity target of 110,000-120,000 units per month by Q2 2026; 1.6T volume production expected June-July 2026 with 4-5 product variants
Q&A themes
- 800G qualifications imminent with meaningful Q4 revenue expected; company has delivered thousands of qualification samples to multiple customers with initial volume orders expected within weeks
- Hyperscale customer commitments for 800G/1.6T totaling over 300,000 units (AOI's share), demonstrating strong real demand and justifying CapEx investments
- Silicon photonics technology preferred by customers over EML for 800G/1.6T due to laser efficiency (requires 2 vs. 8 lasers) and company's in-house laser manufacturing advantage addressing industry laser shortages
- CATV share gains across 7 current customers with 10 additional expected by end of 2026; new software modules (QuantumLink) providing additional revenue opportunity through operational efficiency
Risks
- Tariff impact of $1.1 million in Q3 income statement and $1.9 million on capital equipment (4%); tariff rates and import mix may cause future results to vary materially
- CATV revenue lumpy and subject to customer timing; revenue concentration with top 10 customers at 97% of total, with single CATV customer representing 66% of revenue
- 800G/1.6T production ramp dependent on capacity expansion execution and customer qualification completion; meaningful manufacturing cycle time of 1.5 months creates timing risks for volume ramp
FY2025 Q22025-08-07
Earnings calls
AI summary
mixedAOI achieved 30% year-over-year datacenter revenue growth and over 8x CATV growth, with gross margin expanding to 30.4%, though EPS missed guidance due to strategic investments in 800G/1.6Tb qualification and new customer engagement. The company completed first 400G volume shipments to a major hyperscale customer and secured factory qualification for 800G production, setting up anticipated Q3/Q4 800G revenue ramp. Management expects record or near-record CATV revenue in Q3 driven by 1.8GHz amplifier deployments across multiple MSO customers including Charter.
Key takeaways
- Datacenter revenue grew 30% YoY and 40% sequentially to $44.8M; 400G products increased 43% YoY with first volume shipments to major hyperscale customer completed
- CATV revenue surged 8x YoY to $56M despite 13% sequential decline due to production retooling; Charter deployment certification completed with 1.8GHz amplifiers and QuantumLink software
- Non-GAAP EPS of ($0.16) missed guidance due to $2.6M R&D increase and $2.5M SG&A increase supporting 800G/1.6Tb qualification and customer engagement efforts
- 800G production capacity targeted at ~40,000 units/month by end of 2025 in Texas facility; expects 200,000+ units/month by mid-2026; meaningful 800G shipments expected late Q3 or Q4
- 1.6Tb volume manufacturing targeted for June/July 2026; at least 3 Tier 1 customer engagements underway with multiple stages of qualification beyond sampling
Financial highlights
- Q2 total revenue: $103M (YoY +100%, inline with guidance of $100-110M)
- Q2 datacenter revenue: $44.8M (YoY +30%, sequential +40%); 100G products YoY +25%, 400G products YoY +43%
- Q2 CATV revenue: $56M (YoY +800%, sequential -13%); 54% of total revenue
- Q2 non-GAAP gross margin: 30.4% (inline with guidance 29.5-31%, YoY +790bps from 22.5%)
Guidance
- Q3 revenue guidance: $115M-$127M (sequential increase in both CATV and datacenter)
- Q3 non-GAAP gross margin: 29.5%-31%
- Q3 non-GAAP net income (loss): ($5.9M) to ($2M), or ($0.10) to ($0.03) per share
- Full year 2025 CapEx target: $120M-$150M
Q&A themes
- 800G and 1.6Tb represent significant growth drivers with at least 3 Tier 1 customer engagements; production capacity expansion underway in both Texas and Taiwan facilities
- Cable TV demand remains robust with 6+ MSO customers in qualification or deployment stages; node product expected to launch Q4 2025 with revenue beginning Q4 or Q1 2026
- Vertical integration opportunities through wafer size progression (2-inch to 3-inch to 4-inch) expected to drive significant cost reductions; mix of in-sourced and external laser components per customer requirements
- Channel inventory levels managed appropriately for cable TV business; extended payment terms offered to support in-country staging of products ahead of customer deployment needs
Risks
- EPS missed guidance due to elevated operating expenses; company continues operating at loss despite revenue growth momentum
- Production capacity constraints on 800G qualification timeline dependent on equipment arrival and bring-up at Texas facility; meaningful ramp delayed to late Q3/Q4
- Operating expenses expected to remain elevated at $41-44M per quarter; path to profitability dependent on 800G revenue ramp and gross margin expansion initiatives
Company news
Reuters, WSJ, Bloomberg and FT first, as far as our news provider delivers them; other publishers behind the second filter. Headlines link to the publisher.No articles from Reuters, WSJ, Bloomberg or FT for this company in our feed.
Company data
Company intelligence
Updated: Nov 15, 2026, 03:16 AM UTC
Company data
Company intelligence
Company profile
- Sector
- Technology
- Industry
- Communication Equipment
- Chief executive
- Chih-Hsiang Lin
- Employees
- 4,691
- IPO date
- Sep 26, 2013
- Country
- US
- Exchange
- NASDAQ Global Market
Rating factors
- Return on equityi
- 1/5
- Return on assetsi
- 1/5
- Debt to equityi
- 3/5
- Price to earningsi
- 1/5
- Price to booki
- 1/5
Company press releases
Market cap history
Not comparable with the headline: the provider's history counts about 85.4M shares, the headline 90.77M. Shown as the provider reports it.
Largest fund holders
| Fund | Weight | Shares held |
|---|---|---|
| VTI | 0.01% | 2.4M |
| BAI | 1.13% | 1.6M |
| NJM | 0.36% | 1.6M |
| VGT | 0.06% | 936.9K |
| VB | 0.05% | 895.7K |
| VXF | 0.1% | 876.4K |
| VVORX | 0.83% | 760.8K |
| VBK | 0.12% | 504.1K |
| IWP | 0.22% | 436.3K |
| NLO | 0.54% | 431.3K |
| CGOAX | 1.23% | 402K |
| FSMAX | 0.09% | 364.4K |
Analyst track record
How the analysts covering AAOI have done: ratings, price-target accuracy and the measured reaction after their calls.
| 12 months | 3 years | |
|---|---|---|
| Ratings | 36 | 79 |
| Analysts | 5 | 6 |
| Buy / hold / sell | 26 / 9 / 1 | 60 / 17 / 2 |
| Upgrades / downgrades / initiations | 2 / 1 / 0 | 4 / 3 / 3 |
| Price targets hit / missed | 11 / 25 (31%) | 52 / 26 (67%) |
| Avg. return after a rating (TipRanks) | -24.1% | +63.6% |
| Best / worst call | +252.3% / -76.0% | +487.2% / -76.0% |
After buy calls on this stock: median 21-day move +1.8% vs S&P 500 +1.7% (n = 62)
Most accurate on this stock
Share of an analyst's price targets on this stock that the price reached within 12 months (our measurement over the last 3 years, at least 8 targets). It describes past calls, not the odds of the current one.
- Tim SavageauxNorthland Securities100% hit rate on this stock · 10 targets measuredBuytarget $120Nov 2, 2026
- Michael GenoveseRosenblatt Securities92% hit rate on this stock · 13 targets measuredBuytarget $115Nov 6, 2026
Latest ratings
| Date | Analyst | Call | Target | |
|---|---|---|---|---|
| Nov 6, 2026 | Simon LeopoldRaymond JamesNov 6, 2026 | BuyMaintained | $165↗ | article ↗ |
| Nov 6, 2026 | Dave KangB. Riley SecuritiesNov 6, 2026 | HoldMaintained | $45.00↗ | article ↗ |
| Nov 6, 2026 | Michael GenoveseRosenblatt SecuritiesNov 6, 2026 | BuyMaintained | $115↗ | article ↗ |
| Nov 2, 2026 | Tim SavageauxNorthland SecuritiesNov 2, 2026 | BuyUpgraded | $120↗ | article ↗ |
| Oct 15, 2026 | Dave KangB. Riley SecuritiesOct 15, 2026 | HoldMaintained | $92.00↗ | article ↗ |
Share of analysts per call each month (latest call per analyst within 180 days). Targets and closes in USD.
TipRanks data · computed Nov 13, 2026 · 36 ratings
Frequently asked questions
Where can I trade AAOI perpetual futures?
Applied Optoelectronics, Inc. (AAOI) perpetual futures trade on 24 crypto venues, including Bitget, Binance, Gate.io. PerpEquities compares them by live price, funding rate, open interest and liquidity.
Can I trade AAOI around the clock?
Yes. Unlike the underlying stock, AAOI perpetuals trade 24/7 — including weekends and outside regular market hours.
What is the funding rate on AAOI perpetuals?
Right now the AAOI perp funding rate is 0.0% annualized (venue median), ranging from 0.0% to 0.0% across 24 venues. A positive rate means longs pay shorts. PerpEquities shows the live rate and its history for every venue.
How does the AAOI perp price compare to the Applied Optoelectronics, Inc. stock?
The venue-median AAOI perp mark is $48.3 versus a reference stock price of $48.2, a basis of +0.1%. Perps follow the stock through an index price; the gap widens when funding or liquidity diverge between venues.
What is a AAOI perpetual future?
A AAOI perpetual is a derivative that tracks the price of Applied Optoelectronics, Inc. with no expiry date. It lets you take long or short exposure to Applied Optoelectronics, Inc. on crypto venues, around the clock.
What is AAOIUSDT perpetual?
AAOIUSDT is the symbol most crypto exchanges use for the Applied Optoelectronics, Inc. perpetual settled in USDT (Tether). It tracks the AAOI share price through an index, trades 24/7 with leverage and never expires.
Embed this asset
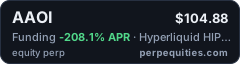
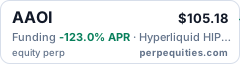
<a href="https://perpequities.com/stocks/aaoi-perp"><img src="https://perpequities.com/badge/aaoi-perp.svg" width="240" height="64" alt="AAOI perpetuals · perpequities.com" loading="lazy"></a>