
Equity · Technology
Flex Ltd. (FLEX) perpetual futures
FLEX perpetual futures on 13 crypto exchanges – live perp price vs the stock, funding rate, open interest and where to trade FLEXUSDT.
Flex Ltd. provides design, engineering, manufacturing, and supply chain solutions for OEMs across industries, including solar tracker systems and power components.
Price chart
Use the left and right arrow keys to inspect points on the chart.
Trading data
Perpetual market activity
13/13 live markets
Trading data
Perpetual market activity
Spot performance
Venue matrix
13 markets
Some venue links are sponsored. We may receive a commission, and eligible users may occasionally receive trading-fee discounts, at no additional cost to you.
| Trade | ||||||||||||
|---|---|---|---|---|---|---|---|---|---|---|---|---|
 LBank | Trade | FLEX/USDT | Trading | $74.11 | 0.0% APR 0.000% every 8h | +12.1 bps | $493.6K | $217.4K | $85.9K | USDT | 50x | |
 Binance | Trade | FLEX/USDT | Trading | $74.10 | 0.0% APR 0.000% every 8h | +12.1 bps | $49K | $208.7K | $310.8K | USDT | - | |
 Bitget | Trade | FLEX/USDT | Trading | $74.07 | 0.0% APR 0.000% every 8h | +5.4 bps | $236.2K | $142.5K | $84.2K | USDT | 20x | |
 XT.com | Trade | FLEX/USDT | Trading | $74.17 | +11.0% APR +0.010% every 8h | +20.2 bps | $7.3K | $131.7K | - | USDT | 25x | |
 MEXC | Trade | FLEX/USDT | Trading | $73.86 | -13.5% APR -0.012% every 8h | +371.5 bps | $0 | $98.2K | $131.2K | USDT | 20x | |
 Gate.io | Trade | FLEX/USDT | Trading | $74.05 | 0.0% APR 0.000% every 8h | +40.4 bps | $12.4K | $85K | $99.4K | USDT | 20x | |
 Bitunix | Trade | FLEX/USDT | Trading | $74.11 | +23.0% APR +0.021% every 8h | +9.4 bps | $973.7K | $71.5K | $20.1K | USDT | 50x | |
 Bybit | Trade | FLEX/USDT | Trading | $74.19 | 0.0% APR 0.000% every 8h | +29.7 bps | $4.9K | $46.7K | $187.6K | USDT | 25x | |
 OKX | Trade | FLEX/USDT | Trading | $74.08 | 0.0% APR 0.000% every 8h | +37.3 bps | $10.2K | $9.3K | $21.3K | USDT | 20x | |
 HTX | Trade | FLEX/USDT | Trading | $74.11 | +11.0% APR +0.010% every 8h | +31.1 bps | $2.2M | $8.1K | $8K | USDT | - | |
 Deepcoin | Trade | FLEX/USDT | Trading | $74.10 | - | +12.1 bps | $9.3K | $858.1K | - | USDT | 25x | |
 BingX | Trade | FLEX-USDT | Trading | $74.11 | +5.5% APR +0.00500% every 8h | +13.5 bps | $71K | $722.4K⚠ | $699.8 | USDT | - | |
 KuCoin | Trade | FLEX/USDT | Trading | $74.05 | 0.0% APR 0.000% every 8h | +31.1 bps | $3.3K | $680.4K⚠ | $2.7K | USDT | 20x |
Unverified volume: implausibly high against open interest, a typical sign of wash trading. These venues are listed last.
Tokenized wrappers of the real stock, tradable on-chain and on crypto exchanges around the clock. Premium/discount compares the token price to our stock reference price. Data: CoinMarketCap · Robinhood · DexScreener · GeckoTerminal.
| Product | Price | Premium vs stock | 24h Vol. | Market Cap | Chains |
|---|---|---|---|---|---|
| FLEXxxStocks | $74.38 | +0.36% | $32 | $43k | Ethereum · BNB Smart Chain (BEP20) · Solana |
Tradability
Execution quality
Entry cost and depth per venue at $1k–$100k
Tradability
Execution quality
Entry cost and depth per venue at $1k–$100kBroad liquidity · 8 of 13 venues absorb $10k · Typical cost: +32.7 bps – +69.2 bps
Too thin: Gate.io, XT.com, Bybit, KuCoin
No fresh book data: MEXC
Taker execution estimate incl. approx. fees - maker fills are not guaranteed.
Best venues for this underlying
Best liquidity
FLEXTightest spread
FLEXHighest volume
FLEXFunding history
Stored venue snapshots by market
Funding history
Stored venue snapshots by marketNext catalyst
Catalysts
Next catalyst
Catalysts
No unusual perp activity right now.
Research data
Analysts, filings and peer context
Research data
Analysts, filings and peer context
Estimates
6Company events
6Peer comparison
Similar listed perpsRevenue mix
Latest annualAnalysts
Price targets in USD| Consensus rating | Buy |
|---|---|
| Average 12-month price target | $151 |
| 12-month target range (low – high) | $128 – $170 |
| Ratings in the provider's consensus | 26 |
Price targets as of 2026-11-15
Analyst rating history
Ratings| Month | Strong buy | Buy | Hold | Sell | Strong sell |
|---|---|---|---|---|---|
| Nov 2026 | 3 | 8 | 0 | 0 | 0 |
| Oct 2026 | 3 | 8 | 0 | 0 | 0 |
| Sep 2026 | 3 | 8 | 0 | 0 | 0 |
| Aug 2026 | 3 | 8 | 0 | 0 | 0 |
| Jul 2026 | 3 | 8 | 1 | 0 | 0 |
| Jun 2026 | 3 | 7 | 1 | 0 | 0 |
| May 2026 | 3 | 7 | 1 | 0 | 0 |
| Apr 2026 | 3 | 7 | 0 | 0 | 0 |
| Mar 2026 | 3 | 7 | 0 | 0 | 0 |
| Feb 2026 | 3 | 6 | 0 | 0 | 0 |
| Jan 2026 | 3 | 6 | 1 | 0 | 0 |
| Dec 2025 | 2 | 6 | 1 | 0 | 0 |
Ownership
Institutional · 2026-Q3Reference market activity
FLEX-PERPPrice performance
11Insider activity
FY2026 Q3Insider transactions
25Director William D Watkins received a 413-share award of Flex Ordinary Shares on Oct 15, 2026, at $0.00, and held 102,479 shares afterward.
Flex director Tan Lay Koon received an A-Award grant of 133 ordinary shares at $0.00 on 2026-10-15, bringing holdings to 210,967 shares. A grant is compensation, not an open-market purchase.
Flex director Michael E. Hurlston received a grant of 228 Ordinary Shares on Oct 15, 2026, at $0.00, leaving him with 61,924 shares owned.
Flex Ltd. director Oliver George received an award of 1,802 ordinary shares at $0.00, leaving him with 1,802 shares owned after the transaction.
Flex Ltd. director Oliver George filed a Form 3 on 2026-09-25, reporting 0 shares of common stock as of 2026-09-24, at $0.00 and 0 shares owned after.
Flex Ltd. director Eubanks Richard M. received an award of 1,802 ordinary shares at $0.00, holding 1,802 shares afterward.
Flex Ltd. director Richard M. Eubanks filed a Form 3, an initial statement of beneficial ownership. The single reported line shows 0 shares of common stock, so no acquisition, disposal or purchase occurred on this filing.
Michael P. Hartung, Chief Commercial Officer of Flex Ltd., sold 2,755 ordinary shares in 5 open-market transactions on August 18, 2026, at prices ranging from $119.79 to $123.25 per share.
Flex Ltd. CEO Advaithi Revathi disposed of 35,051 ordinary shares in a non-open-market transaction (code J), retaining 117,857 shares.
Director William D. Watkins received a total of 3,158 ordinary shares of Flex Ltd. through three compensation awards on August 5, 2026.
Director Pat Ward received 2,338 ordinary shares of Flex Ltd. in two compensation awards on August 5, 2026 (price $0.00).
Director Tan Lay Koon received a grant of 1,928 ordinary shares of Flex Ltd. as compensation (no cash paid) on August 5, 2026.
Director Maryrose Sylvester received a total of 2,338 ordinary shares of Flex Ltd. as compensation on August 5, 2026.
Director acquired 3,158 ordinary shares in 2 awards (A) on 2026-08-05, at $0.00 each.
Director McSweeney Erin received a grant of 1,928 ordinary shares of Flex Ltd. (FLEX) on August 5, 2026, at no cost, increasing her holdings to 11,440 shares.
Flex director Michael Hurlston was granted 410 ordinary shares on Aug 5, 2026 (A-Award, $0.00), leaving him with 61,696 shares directly held.
Filings
100 · Latest SEC filingsDirector William D Watkins received a 413-share award of Flex Ordinary Shares on Oct 15, 2026, at $0.00, and held 102,479 shares afterward.
Flex director Tan Lay Koon received an A-Award grant of 133 ordinary shares at $0.00 on 2026-10-15, bringing holdings to 210,967 shares. A grant is compensation, not an open-market purchase.
Flex director Michael E. Hurlston received a grant of 228 Ordinary Shares on Oct 15, 2026, at $0.00, leaving him with 61,924 shares owned.
Flex Ltd. director Oliver George filed a Form 3 on 2026-09-25, reporting 0 shares of common stock as of 2026-09-24, at $0.00 and 0 shares owned after.
Flex Ltd. director Eubanks Richard M. received an award of 1,802 ordinary shares at $0.00, holding 1,802 shares afterward.
Flex Ltd. director Richard M. Eubanks filed a Form 3, an initial statement of beneficial ownership. The single reported line shows 0 shares of common stock, so no acquisition, disposal or purchase occurred on this filing.
Flex Ltd. director Oliver George received an award of 1,802 ordinary shares at $0.00, leaving him with 1,802 shares owned after the transaction.
Flex Ltd. CEO Advaithi Revathi disposed of 35,051 ordinary shares in a non-open-market transaction (code J), retaining 117,857 shares.
Michael P. Hartung, Chief Commercial Officer of Flex Ltd., sold 2,755 ordinary shares in 5 open-market transactions on August 18, 2026, at prices ranging from $119.79 to $123.25 per share.
Director Maryrose Sylvester received a total of 2,338 ordinary shares of Flex Ltd. as compensation on August 5, 2026.
Director acquired 3,158 ordinary shares in 2 awards (A) on 2026-08-05, at $0.00 each.
Director McSweeney Erin received a grant of 1,928 ordinary shares of Flex Ltd. (FLEX) on August 5, 2026, at no cost, increasing her holdings to 11,440 shares.
Director Pat Ward received 2,338 ordinary shares of Flex Ltd. in two compensation awards on August 5, 2026 (price $0.00).
Director William D. Watkins received a total of 3,158 ordinary shares of Flex Ltd. through three compensation awards on August 5, 2026.
Director Tan Lay Koon received a grant of 1,928 ordinary shares of Flex Ltd. as compensation (no cash paid) on August 5, 2026.
Flex director Michael Hurlston was granted 410 ordinary shares on Aug 5, 2026 (A-Award, $0.00), leaving him with 61,696 shares directly held.
Director John D. Harris received a grant of 1,928 ordinary shares of Flex Ltd. (FLEX) on August 5, 2026, and now owns 56,319 shares.
Flex Ltd. director Michael E. Hurlston was awarded 174 ordinary shares on 2026-07-15, bringing his total holdings to 59,358 shares. This was a compensation grant, not an open-market purchase.
Flex Ltd. director William D. Watkins was awarded 316 ordinary shares on 2026-07-15, bringing his total ownership to 98,908 shares.
Flex Ltd. director Tan Lay Koon received a grant of 101 ordinary shares on 2026-07-15, bringing total holdings to 208,906 shares.
On June 17, 2026, officer Daniel Wendler sold 1,048 ordinary shares of Flex Ltd. in two open-market transactions at prices between $142.28 and $143.26, reducing his holdings to 42,085 shares.
Flex EVP & General Counsel David Scott Offer sold 27,469 ordinary shares across 8 transactions on 6/17-6/18/2026 at prices from $141.72 to $146.39, leaving 91,122 shares owned afterward.
On June 17-18, 2026, officer Michael P. Hartung sold 29,896 ordinary shares of Flex Ltd. in 8 open-market transactions at prices ranging from $141.78 to $146.26.
Flex Ltd. COO Tan Kwang Hooi sold 35,638 ordinary shares across 8 transactions on June 17-18, 2026, at prices between $141.65 and $146.41, leaving 248,546 shares owned afterward.
CEO Advaithi Revathi sold 237,067 Flex Ltd. ordinary shares across 19 transactions on 2026-06-17, at prices ranging from $141.74 to $149.19, leaving 636,112 shares owned afterward.
Flex Ltd. CAO Daniel Wendler received a grant of 9,716 ordinary shares and separately sold 1,579 ordinary shares in 4 trades at $144.09-$149.19 per share.
Flex EVP & General Counsel David Scott Offer received a grant of 43,724 ordinary shares (no purchase), and separately sold 25,973 ordinary shares across 9 trades on Jun 15-16, 2026 at prices between $146.00 and $149.60.
Flex Ltd. Chief Commercial Officer Michael Hartung received an award of 43,724 ordinary shares (compensation grant), and separately sold 8,203 ordinary shares across 5 trades at prices between $146.07 and $149.61.
Flex COO Tan Kwang Hooi received a grant of 48,582 ordinary shares as compensation, and separately sold 10,540 ordinary shares across 4 trades at prices from $146.09 to $149.00.
Flex CFO Kevin Krumm sold 3,378 ordinary shares on 2026-06-15 across 6 trades at prices from $146.02 to $149.61, leaving 151,280 shares owned afterward.
On June 15-16, 2026, CEO Advaithi Revathi reported an award of 255,062 ordinary shares and sold 39,239 shares at prices between $146.00 and $149.55.
Chief Operating Officer Tan Kwang Hooi received a grant of 7,599 ordinary shares of Flex Ltd. on June 11, 2026, at no cost, increasing holdings to 246,142 shares.
Kevin Krumm, CFO of Flex Ltd., received an award of 10,855 ordinary shares at $0.00 (grant/compensation), increasing his holdings to 154,658 shares.
Officer Daniel Wendler received 1,480 ordinary shares as an award (grant) from Flex Ltd., increasing his holdings to 34,996 shares.
Award: On June 11, 2026, David Scott Offer received a grant of 7,164 ordinary shares of Flex Ltd. at no cost, increasing his holdings to 82,090 shares.
Chief Commercial Officer Hartung Michael P received a grant of 7,599 ordinary shares at no cost, increasing his holdings to 240,305 shares.
Executive sold 33,000 ordinary shares in 3 transactions at $152.97-$155.18, reducing holdings to 73,471.
Director McSweeney Erin sold 2,000 Flex Ltd. ordinary shares at $132.51 each in an open-market transaction.
On 2026-05-22, CEO Advaithi Revathi sold 83,500 ordinary shares of Flex Ltd. in 6 open-market transactions at prices ranging from $129.1839 to $134.0329, reducing her holdings to 605,522 shares.
Transcripts
Earnings callsFY2026 Q42026-05-06
Earnings calls
AI summary
positiveFlex reported FY2026 Q4 revenue of $7.5B (up 17% YoY) with record adjusted gross margin of 9.9% and adjusted operating margin of 6.7%. The company announced its intent to spin off the CPI segment (expected to close Q1 2027), with SpinCo targeting 65-75% revenue growth in FY2027 and over 80% in FY2028, while Flex expects low to mid-single-digit growth. CEO Revathi Advaithi will lead SpinCo, with Michael Hartung becoming CEO of Flex.
Key takeaways
- Announced spin-off of Cloud and Power Infrastructure segment into standalone company (SpinCo) expected to complete Q1 2027
- SpinCo targeting 65-75% revenue growth in FY2027 and 80%+ growth in FY2028, driven by multiyear contracts including Google and expanded power/thermal capabilities
- FY2027 full-year guidance: revenue $32.3B-$33.8B (up 18% midpoint), adjusted operating margin 7.0-7.1%, adjusted EPS $4.21-$4.51 (up 32% midpoint)
- Completed acquisition of Electrical Power Products (EP2) to strengthen utility-grade power portfolio for grid modernization
- Revathi Advaithi to lead SpinCo as CEO; Michael Hartung elevated to CEO of Flex post-spin
Financial highlights
- Q4 FY2026: Revenue $7.5B (+17% YoY), adjusted gross margin 9.9% (record, +50 bps), adjusted operating margin 6.7% (record, +50 bps), adjusted EPS $0.93 (+27% YoY)
- FY2026 full year: Revenue $27.9B (+8% YoY), adjusted gross margin 9.5% (+70 bps), adjusted operating margin 6.3% (+70 bps), adjusted EPS $3.30 (+25% YoY)
- FY2026 free cash flow: $1.1B; Q4 CapEx $201M; full-year CapEx $625M (2.2% of revenue); stock repurchases $944M (19M shares)
- CPI segment FY2026: Revenue $6.6B (+38% YoY), adjusted operating margin 9.2% (-100 bps due to infrastructure investments and ramp costs)
Guidance
- FY2027 total Flex: Revenue $32.3B-$33.8B (up 18% midpoint), adjusted operating margin 7.0-7.1% (+80 bps), adjusted EPS $4.21-$4.51 (up 32% midpoint)
- SpinCo (CPI): Revenue growth 65-75% in FY2027, over 80% in FY2028; margin improvement of 100 bps in FY2027 (recouping FY2026 investments) plus 50-100 bps additional expansion in FY2028
- Flex post-spin (RMS+ITS): Low to mid-single-digit revenue growth in FY2027-2028; focus on healthcare, warehouse automation, networking, and robotics
- FY2027 CapEx: $1.4B-$1.6B (elevated due to CPI program ramps); expected to normalize to historical levels in FY2028 with CPI at 2.5-3% of revenue and ITS/RMS below 2%
Q&A themes
- Power segment to outpace cloud growth within CPI; power margins higher than cloud margins, with cloud margin convergence expected as ramp costs digest through FY2027-2028
- Google multiyear contract is part of broader diversified customer base including multiple hyperscalers, colos, neoclouds, and utilities; awards span power infrastructure, thermal systems, and complex hardware manufacturing
- Migration from individual product sales to complete integrated architecture solutions as customers re-architect organizations; capacity already booked out for next couple years
- Post-spin Flex to focus on margin expansion through productivity improvements using AI-enabled technologies, continued portfolio optimization, and investment in high-return growth markets like healthcare
Risks
- Elevated capital intensity with CapEx of $1.4B-$1.6B expected in FY2027 (unique to that fiscal year) as infrastructure and manufacturing capacity ramp for CPI programs
- Execution risk on spin transaction and standalone operations of both companies, particularly SpinCo's ability to maintain growth trajectory and manage rapid scaling
- Customer concentration risk within SpinCo, with significant revenue dependent on multiyear contracts with hyperscalers (Google, others) and utility customers in evolving AI data center market
FY2026 Q32026-02-04
Earnings calls
AI summary
positiveFlex achieved another record quarter with $7.1 billion in revenue, up 8% year-over-year, and record adjusted operating margins of 6.5%, up 40 basis points. Adjusted EPS grew 13% to $0.87, reflecting strength in data center power and compute, alongside improving performance in industrial, health solutions, and network infrastructure. The company raised full-year guidance with revenue expected between $27.2-27.5 billion and adjusted EPS between $3.21-3.27.
Key takeaways
- Q3 revenue of $7.1B (+8% YoY) with record adjusted operating margin of 6.5%, up 40 bps YoY; adjusted EPS $0.87 (+13% YoY)
- Data center business accelerating with partnerships including NVIDIA on modular systems, LG on thermal management, and launch of AI infrastructure platform designed to accelerate deployment by up to 30%
- Power segment delivering 35% data center growth; embedded power benefiting from 800-volt DC technology shift with limited competitive set; critical power driven by lead time management and installation speed
- Reliability Solutions segment margins at 7.2% (+50 bps YoY) driven by power mix and core industrial improvements; Agility revenue up 6% offset by consumer softness but supported by high-speed networking and satellite communications
- Full-year FY2026 guidance raised: revenue $27.2-27.5B (+$350M vs. prior), adjusted EPS $3.21-3.27 (+$0.11 midpoint), operating margin ~6.3%, 80%+ free cash flow conversion
Financial highlights
- Q3 revenue $7.1B, up 8% YoY; adjusted gross margin 9.8%; adjusted operating margin 6.5% (up 40 bps YoY, a record)
- Adjusted EPS $0.87, up 13% YoY; Reliability Solutions revenue $3.2B (+10% YoY) with operating margin 7.2%; Agility Solutions revenue $3.8B (+6% YoY) with operating margin 6.3%
- Q3 operating cash flow $275M with inventory at 56 days (flat YoY); net CapEx $145M (~2% of revenue); share repurchase $200M (~3.3M shares)
- FY2026 guidance: revenue $27.2-27.5B (up $350M midpoint vs. prior); adjusted operating margin ~6.3%; adjusted EPS $3.21-3.27; 80%+ free cash flow conversion
Guidance
- FY2026 full-year: Revenue $27.2-27.5B; adjusted operating margin approximately 6.3%; adjusted EPS $3.21-3.27 per share
- Q4 FY2026: Reliability Solutions revenue expected up low double digits to mid-teens; Agility Solutions revenue up low to mid-single digits
- FY2026 Reliability outlook: revenue up mid-single digits driven by data center power, core industrial, and health solutions; Agility: revenue up mid-single digits with cloud/networking growth offset by consumer softness
- Data center business expected to maintain strong growth trajectory into next fiscal year; continued capacity investments planned in compute (next years) and embedded power (FY2027)
Q&A themes
- Power business leadership and competitive positioning: Both embedded power (benefiting from 800V DC technology shift with limited competitors) and critical power (schedule/lead time management) growing strongly at 35% data center growth
- Capital allocation: Power investments heavier in FY2026; transitioning to more compute capacity investments in coming years due to AI program deployments; productivity gains expected from AI implementation in own facilities
- Amazon warrant program impact: Not materially incremental to FY2026; deployments complex and scale over time; AWS growth tracking as expected with meaningful contribution expected in future years
- Data center growth drivers: Modular systems with NVIDIA, thermal management innovation, 800V DC rack power deployments driving embedded power acceleration; high-speed networking and NIC cards (not in reported data center numbers) also strong
Risks
- Consumer end markets remain soft, partially offsetting data center strength; forward-looking results dependent on continued AI infrastructure deployment timelines and customer scaling plans
- Data center business scaling and complexity management risks; company competing against traditional electrical suppliers in critical power and narrow competitive set in embedded power 800V DC technology
- Capital intensity required for capacity expansion across multiple segments (power, compute) to support projected growth; manufacturing footprint optimization ongoing across North America and Mexico
FY2026 Q22025-10-29
Earnings calls
AI summary
positiveFlex achieved exceptional Q2 performance with revenue of $6.8 billion (up 4% YoY), operating margin at 6% for the fourth consecutive quarter, and adjusted EPS of $0.79 (up 23% YoY). The company raised full-year FY2026 guidance across all metrics, reflecting strong execution in data center and health solutions despite headwinds from the Ukraine facility shutdown and tariff pressures. Data center business continues to outperform with expected growth of at least 35% for the year, driven by AI infrastructure buildout and partnerships with major cloud providers.
Key takeaways
- Data center business delivering at least 35% YoY growth, outperforming industry rates, with strength in both cloud and power segments
- Operating margin sustained at 6% for fourth consecutive quarter with expectation for continued improvement in H2 FY2026 driven by higher-margin products and services businesses
- Full-year revenue guidance raised to $26.7B-$27.3B (midpoint +$500M); adjusted EPS guidance raised to $3.09-$3.17 (midpoint +$0.17/share)
- Company positioned as key enabler of AI infrastructure with unified platform combining power, cooling and compute; partnerships announced with NVIDIA for 800-volt DC AI factories and Amazon for cloud solutions
Financial highlights
- Q2 revenue: $6.8B, up 4% YoY; gross margin improved to 9.3% (up 80 bps)
- Q2 operating margin: 6% (up 55 bps); adjusted EPS: $0.79 (up 23% YoY)
- Q2 free cash flow: $305M; net CapEx: $148M (~2% of revenue); share repurchases: $297M
- Full-year FY2026 guidance: revenue $26.7B-$27.3B; adjusted operating margin 6.2%-6.3%; adjusted EPS $3.09-$3.17; 80%+ free cash flow conversion target maintained
Guidance
- Data center revenue expected to grow at least 35% for FY2026; detailed updated guidance to be provided at May Investor Day
- Full-year revenue guidance: $26.7B-$27.3B (raised from prior guidance); adjusted operating margin: 6.2%-6.3%
- Q3 FY2026 revenue guidance: $6.65B-$6.95B; adjusted operating income: $405M-$435M; adjusted EPS: $0.74-$0.80
- FY2026 adjusted tax rate expected at 21%; expectation of continued strong cash generation and momentum carrying into early FY2027
Q&A themes
- Data center growth composition includes both custom silicon (where Flex performs well due to specialization requirements) and merchant silicon, with participation across hyperscalers, colocation providers and new cloud players
- Ukraine facility shutdown (approximately 1% of Flex revenue, slightly over $100M revenue headwind in H2) and tariff impacts incorporated into guidance; tariffs largely pass-through for the company
- Automotive business stabilizing with new compute wins across ICE, hybrid and EV platforms; future growth dependent on achieving expected returns and long-term customer commitments
- Meaningful CapEx increases anticipated over 2-5 year cycle to support data center infrastructure opportunity in North America, EMEA and other regions; recent investments in Guadalajara, Dallas, Fontana, Colombia and Poland facilities
Risks
- Ukraine facility missile strike damage resulted in ~$100M+ revenue headwind in H2 FY2026; facility rebuilding underway
- Tariff landscape remains fluid and uncertain despite being largely pass-through; company continues to monitor and adjust guidance as needed
- Automotive market remains soft despite stabilization; meaningful future growth in this segment contingent on improved margins and customer commitments
FY2026 Q12025-07-24
Earnings calls
AI summary
positiveFlex posted strong Q1 results with $6.6B revenue (up 4% YoY) and record quarterly EPS of $0.72, driven by robust data center growth across cloud and power. The company raised FY2026 guidance with revenue midpoint increased by $600M to $26.5B and operating margin held at 6-6.1%, reflecting confident execution despite macro uncertainty and tariff impacts. Data center business tracking to $6.5B revenue with 35%+ YoY growth, representing 25% of total revenue.
Key takeaways
- Q1 revenue $6.6B (+4% YoY) with adjusted EPS of $0.72 (record for Q1) and operating margin of 6% (+120 bps)
- Data center business on track for $6.5B revenue with 35%+ YoY growth; power expected to grow stronger than cloud
- FY2026 guidance raised: revenue $25.9-27.1B (midpoint +$600M), operating margin 6-6.1%, EPS $2.86-3.06
- Reliability Solutions revenue down 2% YoY but margin expanded 100 bps to 6%; Agility Solutions up 10% with 6.5% margin
- Global footprint of 49M sq ft (7M in US, 9M in Mexico) enables capacity investments; acquired Poland facility to double European power capacity
Financial highlights
- Q1 revenue $6.6 billion, up 4% YoY; gross margin 9.1%, up 130 bps
- Adjusted operating profit $395 million with 6% operating margin, up 120 bps; adjusted EPS $0.72, up 40%+
- Free cash flow $268 million (98% conversion); net inventory down 11% YoY at 55 days
- FY2026 revenue guidance $25.9-27.1 billion; adjusted EPS $2.86-3.06; adjusted operating margin 6-6.1%
Guidance
- Data center expected to deliver approximately $6.5B revenue, growing at least 35% YoY, representing 25% of total revenue
- FY2026 adjusted operating margin 6-6.1%; 80%+ free cash flow conversion target maintained
- Q2 FY2026 revenue $6.5-6.8B; adjusted operating income $375-415M; adjusted EPS $0.70-0.78
- Tariffs largely pass-through; no material impact on FY2026 growth rates; adjusted tax rate 21%
Q&A themes
- Data center capacity investments ongoing (Dallas ramp, Poland facility) to support 35% growth; goal to match demand without excess capacity
- Hyperscaler customers generally purchasing full suite of IT integration, power, and cooling products; high power density driving integrated solution demand
- Automotive and consumer end markets tracking to conservative guidance; green shoots in renewables and networking with strategic share gains
- Power and cooling product capability validated by hyperscaler announcements; Flex positioned uniquely with both manufacturing capability and proprietary IP technology
Risks
- Tariff environment remains dynamic; incorporated June pause assumptions into guidance but subject to change
- Macro uncertainty persists in automotive, consumer devices, and traditional telecom; first half benefits from favorable prior-year comparisons
- Continued investment requirements in data center capacity and programs in second half may pressure near-term margins
FY2025 Q42025-05-07
Earnings calls
FY2025 Q32025-01-29
Earnings calls
Company news
Reuters, WSJ, Bloomberg and FT first, as far as our news provider delivers them; other publishers behind the second filter. Headlines link to the publisher.Company data
Company intelligence
Updated: Nov 15, 2026, 04:38 AM UTC
Company data
Company intelligence
Company profile
- Sector
- Technology
- Industry
- Hardware, Equipment & Parts
- Chief executive
- Revathi Advaithi
- Employees
- 149,686
- IPO date
- Mar 18, 1994
- Country
- US
- Exchange
- NASDAQ Global Select
Rating factors
- Return on equityi
- 4/5
- Return on assetsi
- 3/5
- Debt to equityi
- 1/5
- Price to earningsi
- 1/5
- Price to booki
- 1/5
Company press releases
Congressional disclosures
House
Market cap history
Largest fund holders
| Fund | Weight | Shares held |
|---|---|---|
| NJH | 1.54% | 12.4M |
| VTI | 0.05% | 11.6M |
| VOO | 0.06% | 9.8M |
| VHCAX | 4.71% | 9.6M |
| VPCCX | 5.2% | 5.8M |
| FZAHX | 1.85% | 5.4M |
| IVV | 0.06% | 4.9M |
| 1657.T | 0.05% | 4.9M |
| FXAIX | 0.07% | 4.8M |
| 1557.T | 0.06% | 4.5M |
| SPY | 0.06% | 4.5M |
| VB | 0.25% | 4.2M |
Analyst track record
How the analysts covering FLEX have done: ratings, price-target accuracy and the measured reaction after their calls.
| 12 months | 3 years | |
|---|---|---|
| Ratings | 44 | 133 |
| Analysts | 11 | 17 |
| Buy / hold / sell | 44 / 0 / 0 | 130 / 3 / 0 |
| Upgrades / downgrades / initiations | 2 / 0 / 1 | 4 / 2 / 4 |
| Price targets hit / missed | 8 / 34 (19%) | 86 / 35 (71%) |
| Avg. return after a rating (TipRanks) | -36.7% | +38.9% |
| Best / worst call | +11.6% / -61.5% | +189.3% / -61.5% |
After buy calls on this stock: median 21-day move +6.5% vs S&P 500 +5.1% (n = 126)
Most accurate on this stock
Share of an analyst's price targets on this stock that the price reached within 12 months (our measurement over the last 3 years, at least 8 targets). It describes past calls, not the odds of the current one.
- Ruplu BhattacharyaBank of America Securities100% hit rate on this stock · 13 targets measuredBuytarget $162Oct 29, 2026
- Samik ChatterjeeJ.P. Morgan100% hit rate on this stock · 12 targets measuredBuytarget $160May 7, 2026
- Mark DelaneyGoldman Sachs100% hit rate on this stock · 9 targets measuredBuytarget $160Nov 10, 2026
Latest ratings
| Date | Analyst | Call | Target | |
|---|---|---|---|---|
| Nov 12, 2026 | Steve BargerKeyBancNov 12, 2026 | BuyMaintained | $128↗ | article ↗ |
| Nov 11, 2026 | Tim LongBarclaysNov 11, 2026 | BuyMaintained | $128↗ | article ↗ |
| Nov 10, 2026 | Mark DelaneyGoldman SachsNov 10, 2026 | BuyMaintained | $160↗ | article ↗ |
| Oct 29, 2026 | Steve BargerKeyBancOct 29, 2026 | BuyMaintained | $180↗ | article ↗ |
| Oct 29, 2026 | Tim LongBarclaysOct 29, 2026 | BuyMaintained | $128↗ | article ↗ |
Share of analysts per call each month (latest call per analyst within 180 days). Targets and closes in USD.
TipRanks data · computed Nov 13, 2026 · 44 ratings
Frequently asked questions
Where can I trade FLEX perpetual futures?
Flex Ltd. (FLEX) perpetual futures trade on 13 crypto venues, including Deepcoin, BingX, KuCoin. PerpEquities compares them by live price, funding rate, open interest and liquidity.
Can I trade FLEX around the clock?
Yes. Unlike the underlying stock, FLEX perpetuals trade 24/7 — including weekends and outside regular market hours.
What is the funding rate on FLEX perpetuals?
Right now the FLEX perp funding rate is 0.0% annualized (venue median), ranging from -13.5% to +23.0% across 13 venues. A positive rate means longs pay shorts. PerpEquities shows the live rate and its history for every venue.
How does the FLEX perp price compare to the Flex Ltd. stock?
The venue-median FLEX perp mark is $74.1 versus a reference stock price of $74.1, a basis of 0.0%. Perps follow the stock through an index price; the gap widens when funding or liquidity diverge between venues.
What is a FLEX perpetual future?
A FLEX perpetual is a derivative that tracks the price of Flex Ltd. with no expiry date. It lets you take long or short exposure to Flex Ltd. on crypto venues, around the clock.
What is FLEXUSDT perpetual?
FLEXUSDT is the symbol most crypto exchanges use for the Flex Ltd. perpetual settled in USDT (Tether). It tracks the FLEX share price through an index, trades 24/7 with leverage and never expires.
Embed this asset
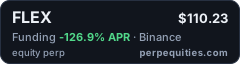
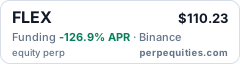
<a href="https://perpequities.com/stocks/flex-perp"><img src="https://perpequities.com/badge/flex-perp.svg" width="240" height="64" alt="FLEX perpetuals · perpequities.com" loading="lazy"></a>