
Equity · Consumer cyclical
Viking Holdings Ltd (VIK) perpetual futures
VIK perpetual futures on 1 crypto exchange – live perp price vs the stock, funding rate, open interest and where to trade VIKUSDT.
Viking Holdings Ltd provides river and ocean passenger cruise services, along with tour and related tourism offerings, across North America, the United Kingdom and globally.
Price chart
Use the left and right arrow keys to inspect points on the chart.
Trading data
Perpetual market activity
1/1 live markets
Trading data
Perpetual market activity
Spot performance
 MEXC
Tradability
Execution quality
Entry cost and depth per venue at $1k–$100k
Tradability
Execution quality
Entry cost and depth per venue at $1k–$100kNo sufficient depth · 0 of 1 venues absorb $10k
No fresh book data: MEXC
Taker execution estimate incl. approx. fees - maker fills are not guaranteed.
Best venues for this underlying
Best liquidity
VIKTightest spread
VIKHighest volume
VIKFunding history
Stored venue snapshots by market
Funding history
Stored venue snapshots by marketNext catalyst
Catalysts
Next catalyst
Catalysts
No unusual perp activity right now.
Research data
Analysts, filings and peer context
Research data
Analysts, filings and peer context
Estimates
6Company events
6Peer comparison
Similar listed perpsRevenue mix
Latest annualAnalysts
Price targets in USD| Consensus rating | Buy |
|---|---|
| Average 12-month price target | $109.86 |
| 12-month target range (low – high) | $82 – $122 |
| Ratings in the provider's consensus | 15 |
Price targets as of 2026-11-22
Analyst rating history
Ratings| Month | Strong buy | Buy | Hold | Sell | Strong sell |
|---|---|---|---|---|---|
| Nov 2026 | 3 | 19 | 1 | 1 | 0 |
| Oct 2026 | 3 | 18 | 2 | 1 | 0 |
| Sep 2026 | 2 | 18 | 2 | 1 | 0 |
| Aug 2026 | 2 | 17 | 2 | 1 | 0 |
| Jul 2026 | 2 | 17 | 2 | 1 | 0 |
| Jun 2026 | 2 | 16 | 2 | 1 | 0 |
| May 2026 | 3 | 14 | 4 | 1 | 0 |
| Apr 2026 | 3 | 12 | 4 | 1 | 0 |
| Mar 2026 | 3 | 11 | 5 | 1 | 0 |
| Feb 2026 | 3 | 11 | 5 | 1 | 0 |
| Jan 2026 | 3 | 11 | 4 | 1 | 0 |
| Dec 2025 | 3 | 11 | 6 | 1 | 0 |
Ownership
Institutional · 2026-Q3Reference market activity
VIK-PERPPrice performance
11Insider activity
FY2026 Q4Insider transactions
25Viking Holdings officer Jeffrey Dash (EVP, Business Development) reported selling 75,000 ordinary shares across four open-market sales on Nov 17-18, 2026, at prices from $95.02 to $100.08; he held 320,022 shares afterward.
Viking Holdings officer Jeffrey Dash sold 25,000 ordinary shares at $90.23 on Nov 4, 2026, leaving 395,022 shares owned.
Officer Hugh Milton sold 20,000 Viking Holdings ordinary shares in an open-market sale at $90.19 each, leaving 565,571 shares owned.
Viking Holdings officer Hugh Milton (EVP, Sales) sold 20,000 ordinary shares in 3 open-market sales on 2026-09-11 at $84.96-$86.80, leaving 585,571 shares owned.
Officer Hofmann Anton sold 94,276 ordinary shares of Viking Holdings in two open-market sales on June 15, 2026, at prices from $95.32 to $96.04, leaving 292,819 shares owned.
Viking Holdings officer Richard Marnell (EVP, Marketing) reported 8 open-market sales (S-Sale) of 17,566 ordinary shares total at $92.41–$96.05 on June 12–16, 2026, leaving 110,771 shares owned.
Viking Holdings officer Hofmann Anton sold 5,956 ordinary shares at $91.00 on June 10, 2026, leaving 387,095 shares owned.
Officer Hofmann Anton sold 185,283 Viking ordinary shares in three open-market sales on June 8-9, 2026 at $88.86-$91.32, leaving 393,051 shares owned.
Viking Holdings officer Jeffrey Dash sold 46,369 ordinary shares at $80.23 on April 14, 2026, leaving 420,022 shares owned after the transaction.
Viking Holdings officer Dash Jeffrey reported an open-market sale (S-Sale) of 28,631 ordinary shares at $80.22 on April 8, 2026, leaving 466,391 shares owned after.
Filings
31 · Latest SEC filingsViking Holdings officer Jeffrey Dash (EVP, Business Development) reported selling 75,000 ordinary shares across four open-market sales on Nov 17-18, 2026, at prices from $95.02 to $100.08; he held 320,022 shares afterward.
Viking Holdings officer Jeffrey Dash sold 25,000 ordinary shares at $90.23 on Nov 4, 2026, leaving 395,022 shares owned.
Officer Hugh Milton sold 20,000 Viking Holdings ordinary shares in an open-market sale at $90.19 each, leaving 565,571 shares owned.
Viking Holdings officer Hugh Milton (EVP, Sales) sold 20,000 ordinary shares in 3 open-market sales on 2026-09-11 at $84.96-$86.80, leaving 585,571 shares owned.
Officer Hofmann Anton sold 94,276 ordinary shares of Viking Holdings in two open-market sales on June 15, 2026, at prices from $95.32 to $96.04, leaving 292,819 shares owned.
Viking Holdings officer Richard Marnell (EVP, Marketing) reported 8 open-market sales (S-Sale) of 17,566 ordinary shares total at $92.41–$96.05 on June 12–16, 2026, leaving 110,771 shares owned.
Viking Holdings officer Hofmann Anton sold 5,956 ordinary shares at $91.00 on June 10, 2026, leaving 387,095 shares owned.
Officer Hofmann Anton sold 185,283 Viking ordinary shares in three open-market sales on June 8-9, 2026 at $88.86-$91.32, leaving 393,051 shares owned.
Transcripts
Earnings callsFY2026 Q32026-11-17
Earnings calls
AI summary
mixedViking reported third quarter 2026 total revenue of $2.2 billion, up 9.2% year-over-year, driven by capacity growth and higher revenue per Passenger Cruise Day. Historically low water levels on the Rhine, Main and Danube affected about 70% of river capacity cruise days, with roughly 12% of guests on affected itineraries canceling; management estimated the disruption reduced third quarter revenue and Adjusted Gross Margin by approximately $100 million each. Adjusted EBITDA fell 4.3% to $674 million, and Adjusted EPS was $1.11. Management said 2026 Core Products are 93% booked and 2027 Core Products are 68% booked on approximately 15% capacity growth, while noting the goodwill vouchers will weigh on 2027 river pricing and that the long-term mid-single-digit yield goal likely moves to the low to mid-single-digit range for 2027.
Key takeaways
- Low water levels affected roughly 70% of river capacity cruise days in Q3, and about 12% of guests on affected itineraries canceled, with no scheduled cruises canceled.
- Viking issued approximately $165 million of cancellation vouchers and approximately $265 million of goodwill Future Cruise Vouchers as of November 8, 2026.
- More than 60% of guests who canceled have rebooked, with the vast majority choosing a 2027 river itinerary, and 50% of goodwill vouchers have already been redeemed.
- Management views the 2026 conditions as atypical rather than a new normal and said its strategy of maintaining European river leadership and expanding in Ocean is unchanged.
- Viking secured options for 10 additional European river vessels and 4 additional ocean ships since the last earnings call.
Financial highlights
- Total revenue was $2.2 billion, up 9.2% year-over-year, on Capacity PCD growth of 10.2% and occupancy of 91.3%.
- Adjusted Gross Margin rose 4.1% to $1.4 billion with Net Yield of $612; Adjusted EBITDA was $674 million, down 4.3%, and Adjusted EPS was $1.11.
- Year-to-date Adjusted Gross Margin was $3.5 billion, up 11.3%, and Net Yield was $621, up 4%, with Ocean Net Yield up 5.5% to $624.
- As of September 30, 2026, cash was $4.1 billion, Net Debt was $2.3 billion and Net Leverage was 1.2x; $350 million was returned via share repurchases in the quarter.
Guidance
- For 2027, the company's yield goal will probably change to the low to mid-single-digit range, reflecting goodwill vouchers hitting reported 2027 river pricing.
- The long-term goal remains mid-single-digit yield growth, and management said capacity growth of approximately 15% in itself would lead to good EBITDA growth.
- Full year 2026 committed ship CapEx is about $2.0 billion, or $750 million net of financing; full year 2027 is about $1.0 billion, or $300 million net of financing.
- Scheduled principal payments were $94 million for the remainder of 2026 and $233 million for full year 2027.
Q&A themes
- Analysts pressed on whether excluding goodwill vouchers, 2027 river advance bookings per PCD would be higher, with management calling a 6% to 7% figure directionally accurate.
- Questions focused on the change in the 2027 yield goal to low to mid-single digits and how voucher redemption and remaining shoulder-season inventory factor in.
- Analysts asked about consumer behavior and booking appetite as water levels improve, with management citing quick guest rebooking and 77% of 2027 ocean capacity sold.
- Capital allocation was discussed, with management describing buybacks as opportunistic and disciplined under the $1.0 billion authorization.
Risks
- Low water levels continued into the fourth quarter, with about 70% of river capacity cruise days affected and about 20% of guests on affected itineraries canceling as of mid-November.
- Management said it is too early to reliably estimate the ultimate fourth quarter financial impact of the disruption.
- Goodwill Future Cruise Vouchers applied to 2027 reduce reported 2027 river Advance Bookings and pricing regardless of which Viking product the guest ultimately books.
Company news
Reuters, WSJ, Bloomberg and FT first, as far as our news provider delivers them; other publishers behind the second filter. Headlines link to the publisher.No articles from Reuters, WSJ, Bloomberg or FT for this company in our feed.
Company data
Company intelligence
Updated: Nov 22, 2026, 11:57 AM UTC
Company data
Company intelligence
Company profile
- Sector
- Consumer Cyclical
- Industry
- Travel Services
- Chief executive
- Leah Talacta
- Employees
- 13,000
- IPO date
- May 1, 2024
- Country
- BM
- Exchange
- New York Stock Exchange
Rating factors
- Return on equityi
- 5/5
- Return on assetsi
- 5/5
- Debt to equityi
- 1/5
- Price to earningsi
- 1/5
- Price to booki
- 1/5
Company press releases
Congressional disclosures
House
Market cap history
Largest fund holders
| Fund | Weight | Shares held |
|---|---|---|
| TWCUX | 0.47% | 1.6M |
| FNITX | 0.49% | 1.5M |
| FPURX | 0.33% | 1.2M |
| NIW | 0.5% | 1.2M |
| IWP | 0.51% | 1M |
| IWP1*.MX | 0.43% | 999.3K |
| EQPGX | 0.62% | 919.2K |
| CGUS | 0.66% | 879.8K |
| FFIDX | 0.79% | 813.7K |
| IWR | 0.12% | 757.8K |
| IWR*.MX | 0.11% | 740.9K |
| NBF | 0.05% | 693.3K |
Analyst track record
How the analysts covering VIK have done: ratings, price-target accuracy and the measured reaction after their calls.
| 12 months | 3 years | |
|---|---|---|
| Ratings | 119 | 213 |
| Analysts | 19 | 24 |
| Buy / hold / sell | 90 / 25 / 4 | 156 / 51 / 6 |
| Upgrades / downgrades / initiations | 7 / 1 / 4 | 8 / 2 / 23 |
| Price targets hit / missed | 54 / 61 (47%) | 142 / 61 (70%) |
| Avg. return after a rating (TipRanks) | +0.6% | +41.6% |
| Best / worst call | +59.8% / -31.7% | +225.1% / -31.7% |
After buy calls on this stock: median 21-day move +4.9% vs S&P 500 +3.6% (n = 150)
Most accurate on this stock
Share of an analyst's price targets on this stock that the price reached within 12 months (our measurement over the last 3 years, at least 8 targets). It describes past calls, not the odds of the current one.
- Stephen GramblingMorgan Stanley100% hit rate on this stock · 15 targets measuredHoldtarget $100Nov 18, 2026
- Matthew BossJ.P. Morgan100% hit rate on this stock · 10 targets measuredBuytarget $122Nov 18, 2026
- Steven WieczynskiStifel Nicolaus100% hit rate on this stock · 9 targets measuredBuytarget $115Nov 18, 2026
Latest ratings
| Date | Analyst | Call | Target | |
|---|---|---|---|---|
| Nov 19, 2026 | Benjamin ChaikenMizuho SecuritiesNov 19, 2026 | BuyMaintained | $122↗ | article ↗ |
| Nov 19, 2026 | James HardimanCitiNov 19, 2026 | BuyMaintained | $111↗ | article ↗ |
| Nov 18, 2026 | Andrew DidoraBank of America SecuritiesNov 18, 2026 | BuyReiterated | $105↗ | article ↗ |
| Nov 18, 2026 | Steven WieczynskiStifel NicolausNov 18, 2026 | BuyMaintained | $115↗ | article ↗ |
| Nov 18, 2026 | Tristan M. Thomas-MartinBMO CapitalNov 18, 2026 | BuyMaintained | $115↗ | article ↗ |
Share of analysts per call each month (latest call per analyst within 180 days). Targets and closes in USD.
TipRanks data · computed Nov 19, 2026 · 119 ratings
Frequently asked questions
Where can I trade VIK perpetual futures?
Viking Holdings Ltd (VIK) perpetual futures trade on one crypto venue: MEXC. PerpEquities shows its live price, funding rate, open interest and liquidity.
Can I trade VIK around the clock?
Yes. Unlike the underlying stock, VIK perpetuals trade 24/7 — including weekends and outside regular market hours.
What is the funding rate on VIK perpetuals?
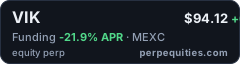
Right now the VIK perp funding rate is -21.9% annualized (one venue). A positive rate means longs pay shorts. PerpEquities shows the live rate and its history.
How does the VIK perp price compare to the Viking Holdings Ltd stock?
The venue-median VIK perp mark is $94.1 versus a reference stock price of $94.1, a basis of 0.0%. Perps follow the stock through an index price; the gap widens when funding or liquidity diverge between venues.
What is a VIK perpetual future?
A VIK perpetual is a derivative that tracks the price of Viking Holdings Ltd with no expiry date. It lets you take long or short exposure to Viking Holdings Ltd on crypto venues, around the clock.
What is VIKUSDT perpetual?
VIKUSDT is the symbol most crypto exchanges use for the Viking Holdings Ltd perpetual settled in USDT (Tether). It tracks the VIK share price through an index, trades 24/7 with leverage and never expires.
Embed this asset
<a href="https://perpequities.com/stocks/vik-perp"><img src="https://perpequities.com/badge/vik-perp.svg" width="240" height="64" alt="VIK perpetuals · perpequities.com" loading="lazy"></a>