
Equity · Consumer defensive
Tyson Foods, Inc. (TSN) perpetual futures
TSN perpetual futures on 1 crypto exchange – live perp price vs the stock, funding rate, open interest and where to trade TSNUSDT.
Tyson Foods is a global food producer operating in four segments—Beef, Pork, Chicken, and Prepared Foods—selling meat and branded convenience foods to retailers, foodservice operators, and distributors worldwide.
Price chart
Use the left and right arrow keys to inspect points on the chart.
Trading data
Perpetual market activity
1/1 live markets
Trading data
Perpetual market activity
Spot performance
 MEXC
Tradability
Execution quality
Entry cost and depth per venue at $1k–$100k
Tradability
Execution quality
Entry cost and depth per venue at $1k–$100kNo sufficient depth · 0 of 1 venues absorb $10k
No fresh book data: MEXC
Taker execution estimate incl. approx. fees - maker fills are not guaranteed.
Best venues for this underlying
Best liquidity
TSNTightest spread
TSNHighest volume
TSNFunding history
Stored venue snapshots by market
Funding history
Stored venue snapshots by marketNext catalyst
Catalysts
Next catalyst
Catalysts
No unusual perp activity right now.
Research data
Analysts, filings and peer context
Research data
Analysts, filings and peer context
Estimates
6Company events
6Peer comparison
Similar listed perpsRevenue mix
Latest annualAnalysts
Price targets in USD| Consensus rating | Buy |
|---|---|
| Average 12-month price target | $69 |
| 12-month target range (low – high) | $65 – $75 |
| Ratings in the provider's consensus | 30 |
Price targets as of 2026-11-22
Analyst rating history
Ratings| Month | Strong buy | Buy | Hold | Sell | Strong sell |
|---|---|---|---|---|---|
| Nov 2026 | 3 | 2 | 8 | 0 | 1 |
| Oct 2026 | 3 | 2 | 7 | 0 | 1 |
| Sep 2026 | 3 | 2 | 8 | 0 | 1 |
| Aug 2026 | 2 | 2 | 8 | 0 | 1 |
| Jul 2026 | 2 | 2 | 8 | 0 | 1 |
| Jun 2026 | 2 | 2 | 8 | 0 | 1 |
| May 2026 | 2 | 4 | 8 | 0 | 1 |
| Apr 2026 | 2 | 4 | 9 | 0 | 1 |
| Mar 2026 | 2 | 4 | 9 | 0 | 1 |
| Feb 2026 | 2 | 4 | 9 | 0 | 0 |
| Jan 2026 | 1 | 4 | 10 | 0 | 0 |
| Dec 2025 | 1 | 3 | 10 | 0 | 0 |
Ownership
Institutional · 2026-Q3Reference market activity
TSN-PERPPrice performance
11Insider activity
FY2026 Q4Insider transactions
25Tyson Foods officer Jacqueline Hanson (Chief People Officer) converted 7,950 performance shares into 4,955 Class A shares via an exempt exercise, and 3,274 Class A shares were withheld for taxes at $63.65-$64.25.
Tyson Foods director and Chairman John H. Tyson filed a Form 4 reporting the exercise of 123,102 performance shares at $0.00 on 2026-11-17, leaving 0 owned after.
Tyson Foods director John R. Tyson converted 56,422 performance shares into 45,420 Class A common shares via an exempt exercise, then 19,620 of those shares were withheld for taxes at $63.65. He held 69,684 shares afterward.
Tyson Foods COO Wes Morris exercised 49,549 Class A shares from 61,551 performance shares on Nov 17-18; 25,751 shares were withheld for taxes at $63.65-$64.25. He held 95,888 shares after.
Tyson Foods officer Adam S. Deckinger converted 25,647 performance shares into 20,645 Class A common shares via an option exercise on Nov 17, 2026. He also had 11,223 Class A shares withheld for taxes at $63.65-$64.25 across three transactions.
Tyson Foods director King Donnie converted 225,687 performance shares into 181,678 Class A common shares and had 92,118 Class A shares withheld for taxes at $63.65–$64.25 across three F-InKind dispositions. He held 596,822 Class A shares after.
Filings
39 · Latest SEC filingsTyson Foods officer Jacqueline Hanson (Chief People Officer) converted 7,950 performance shares into 4,955 Class A shares via an exempt exercise, and 3,274 Class A shares were withheld for taxes at $63.65-$64.25.
Tyson Foods director and Chairman John H. Tyson filed a Form 4 reporting the exercise of 123,102 performance shares at $0.00 on 2026-11-17, leaving 0 owned after.
Tyson Foods director John R. Tyson converted 56,422 performance shares into 45,420 Class A common shares via an exempt exercise, then 19,620 of those shares were withheld for taxes at $63.65. He held 69,684 shares afterward.
Tyson Foods COO Wes Morris exercised 49,549 Class A shares from 61,551 performance shares on Nov 17-18; 25,751 shares were withheld for taxes at $63.65-$64.25. He held 95,888 shares after.
Tyson Foods officer Adam S. Deckinger converted 25,647 performance shares into 20,645 Class A common shares via an option exercise on Nov 17, 2026. He also had 11,223 Class A shares withheld for taxes at $63.65-$64.25 across three transactions.
Tyson Foods director King Donnie converted 225,687 performance shares into 181,678 Class A common shares and had 92,118 Class A shares withheld for taxes at $63.65–$64.25 across three F-InKind dispositions. He held 596,822 Class A shares after.
Tyson Foods director and President & CEO Elect Jeffrey K. Schomburger reported an open-market purchase of 19,450 Class A common shares at $51.497 each on Sept 4, 2026, leaving him with 100,130 shares directly owned.
Tyson Foods director and Chairman John H. Tyson received an award of 51,876 restricted stock units on July 10, 2026, per an amended Form 4 filed August 3, 2026. This was a grant, not an open-market purchase; he holds 51,876 units after.
Tyson Foods director and President & CEO Elect Jeffrey K. Schomburger received an award of 48,418 Class A common shares at $0.00 on July 10, 2026, leaving him 80,680 shares owned. An award is a grant, not an open-market purchase.
Tyson Foods director and Chairman John H. Tyson was awarded 51,876 performance shares and 51,876 restricted stock units at $0.00 on 2026-07-10; both are compensation grants, not purchases.
Tyson Foods COO Wes Morris received a grant of 25,938 Class A common shares at $0.00 per share, bringing his holdings to 70,368 shares.
Tyson Foods COO Wes Morris filed an initial Form 3 reporting holdings: performance shares (3 entries), non-qualified stock options to buy at $48.74–$64.54 (2 entries), and Class A common stock (1 entry), each showing 0 shares in the filing.
Tyson COO Devin Cole reported disposing of 24,923 Class A shares via J-Other and 11,291 shares via F-InKind tax withholding at $68.38, leaving 87,449 shares owned.
Transcripts
Earnings callsFY2026 Q42026-11-16
Earnings calls
AI summary
mixedTyson Foods reported fiscal 2026 adjusted operating income of $1.98 billion and adjusted EPS of $3.44 on adjusted sales of $55.4 billion, up 1.1% excluding legal contingency accruals. Prepared Foods grew segment operating income 5.5% to $1.33 billion, Chicken delivered $1.86 billion despite a roughly 25% decline in industry cutout values, and Beef lost $654 million amid tight cattle supplies. For fiscal 2027, management guides total company adjusted operating income of $1.7 billion to $2.15 billion and sales down 3.5% to 5.5%, primarily on lower beef volume after its network restructuring. New CEO Jeff Schomburger outlined three priorities: be consumer preferred, be indispensable to customers through One Tyson, and win through best cost, noting results will take one to two years to show fully. Free cash flow was $1.7 billion in fiscal 2026, and the Board raised the quarterly dividend 2% to $0.52 per Class A share, the 15th consecutive annual increase.
Key takeaways
- Fiscal 2026 adjusted operating income was $1.98 billion and adjusted EPS was $3.44, in line with September guidance, with results a little better in Beef and a little lighter in Chicken.
- Prepared Foods segment operating income rose 5.5% to $1.33 billion on sales of $10.3 billion, with unit and volume share gains in 45 of 52 weeks.
- Chicken delivered full-year segment operating income of $1.86 billion at a 10.7% margin, just $33 million below last year, with volume up 2.1% for an eighth consecutive quarter of growth.
- Beef lost $654 million for the full year on sales of $21.3 billion, with volume down 12.2%; Tyson is restructuring around three facilities in the Central U.S. cattle belt.
- CEO Jeff Schomburger said fixing innovation success rates and presenting One Tyson to customers will take one or two years to show fully in results.
Financial highlights
- Fiscal 2026 adjusted sales were $55.4 billion, up 1.1% excluding legal contingency accruals, and total company adjusted operating income was $1.98 billion at a 3.5% margin.
- Operating cash flow was $2.4 billion and capital expenditures were $770 million, producing free cash flow of $1.7 billion, up nearly $490 million.
- The company ended the year with $4.1 billion of liquidity and net debt-to-adjusted EBITDA of 2.1x, paid $704 million in dividends and repurchased $427 million of shares in fiscal 2026.
- Fourth quarter Beef results included an $80 million noncash write-down on live cattle inventory after cattle prices fell following purchase.
Guidance
- Fiscal 2027 sales are expected down 3.5% to 5.5%, reflecting lower beef volume, while combined Chicken and Prepared Foods sales are expected to grow 3% to 4%.
- Fiscal 2027 adjusted operating income is guided to $1.7 billion to $2.15 billion, with segment outlooks of $1.25 billion to $1.4 billion in Prepared Foods and $1.3 billion to $1.6 billion in Chicken.
- Beef is guided to a segment operating loss of $300 million to segment operating income of $100 million, Pork to $75 million to $175 million, and International to $125 million to $200 million.
- Fiscal 2027 capital expenditures are guided to $1.1 billion to $1.4 billion and free cash flow to $800 million to $1.3 billion, with net interest expense of about $360 million and an adjusted tax rate around 25%.
Q&A themes
- Analysts pressed on Beef guidance cadence and the split between controllable improvements, network optimization and better cattle availability and spreads.
- Questions focused on Chicken's guidance range, grain and freight costs, and the company's insulation from commodity markets given less than 1% of chicken meat sold on the commodity market.
- Several questions addressed Prepared Foods brand strategy across value, mainstream and premium tiers, including underpenetrated brands with high repeat rates and the role of M&A.
- Management discussed the Allied Beef partnership and the Amarillo second-shift ramp, with ramp-up costs included in guidance and the shift expected fully operational by summer 2027.
Risks
- Beef guidance ranges from a $300 million operating loss to $100 million of operating income, and management said Q2 is typically seasonally challenging due to weather patterns.
- Chicken faces industry supply growth and higher grain and input costs that will pressure the market, though value-added mix and customer relationships cushion rather than eliminate the impact.
- Pork guidance is lower as spreads stay compressed, with increased hog availability pushing product values, bellies in particular, down faster than hog costs.
FY2026 Q32026-08-03
Earnings calls
AI summary
mixedTyson Foods reported Q3 fiscal 2026 sales of $13.9 billion, essentially flat year over year, with segment operating income of $779 million, up $18 million, and adjusted EPS of $0.99, up 9%. Chicken segment operating income was $488 million at an 11.2% margin, while Prepared Foods was $321 million at 12.6%, offset by a Beef segment loss of $138 million. The company narrowed full-year sales growth guidance to 2.5% to 3.5% and adjusted operating income to $2.1 billion to $2.3 billion, citing cattle availability challenges in Beef. CEO Donnie King is transitioning the role to incoming CEO Jeff Schomburger, who said the company will stay the course on the existing strategy. Management described fiscal 2027 qualitatively as looking a lot like 2026, with expected volume and profitability growth, but did not provide formal guidance.
Key takeaways
- Chicken delivered seventh consecutive quarter of year-over-year volume and sales growth, with segment operating income of $488 million and an 11.2% margin, up $40 million year over year.
- Prepared Foods posted a third consecutive quarter of volume and sales growth, with volume share up 70 basis points and the highest volume share ever.
- Beef segment recorded an operating loss of $138 million as volume fell 15.9% amid tighter cattle supply, with footprint optimization benefits offset by USDA margin compression.
- Donnie King said roughly three-quarters of Chicken segment operating income runs on a pull model tied to committed strategic customer demand rather than the open cutout market.
- Incoming CEO Jeff Schomburger said the company will stay the course and accelerate the existing strategy, with more detail to come next quarter.
Financial highlights
- Total company sales were $13.9 billion, essentially flat, as a 3.4% increase in average sales price offset a 2.8% volume decline.
- Total company adjusted operating income was $547 million, a 3.9% margin, and adjusted EPS was $0.99, up 9% year over year.
- Operating cash flow for the first nine months was $1.47 billion and capital expenditures were $556 million, resulting in free cash flow of $913 million.
- The company ended the quarter with $4 billion in liquidity and net leverage of 2.1x, and repurchased $31 million of shares in the quarter.
Guidance
- Full-year sales growth guidance narrowed to 2.5% to 3.5% year over year on a comparable 52-week basis.
- Total company adjusted operating income guidance is now $2.1 billion to $2.3 billion, driven by Beef segment challenges related to cattle availability.
- Beef full-year segment operating income is now expected to be a loss of $650 million to $500 million.
- Prepared Foods outlook midpoint was raised to a range of $1.3 billion to $1.35 billion, while Chicken was reaffirmed at $1.9 billion to $2.05 billion, Pork at $250 million to $300 million and International at $150 million to $200 million.
Q&A themes
- Analysts pressed on the sustainability of Chicken and Prepared Foods performance into fiscal 2027 given commodity chicken and consumer backdrop pressures.
- Questions focused on Beef segment losses, including whether halving losses next year is feasible and the timing of benefits from the phased Mexican border reopening and heifer retention.
- Several questions addressed Prepared Foods margin durability and the timing of commodity cost recovery, including beef trim and pork cost declines flowing through in Q4 and into fiscal 2027.
- Analysts asked about capital allocation given the strong balance sheet, including share repurchases and potential M&A, and about freight cost exposure.
Risks
- Beef segment losses are now guided to $650 million to $500 million for the full year as USDA margin compression and higher cattle costs more than offset network optimization actions.
- The Mexican border reopening is not expected to materially benefit this fiscal year and will take close to a year to fully flow through, and management said it will not solve the entire gap of beef losses.
- Higher fuel and distribution costs since mid-April were a headwind in Q3, though customer freight is described as a pass-through that can lag one or two quarters to recover.
Company news
Reuters, WSJ, Bloomberg and FT first, as far as our news provider delivers them; other publishers behind the second filter. Headlines link to the publisher.Company data
Company intelligence
Updated: Nov 22, 2026, 10:14 AM UTC
Company data
Company intelligence
Company profile
- Sector
- Consumer Defensive
- Industry
- Agricultural Farm Products
- Chief executive
- Jeffrey K. Schomburger
- Employees
- 133,000
- IPO date
- Mar 17, 1980
- Country
- US
- Exchange
- New York Stock Exchange
Rating factors
- Return on equityi
- 2/5
- Return on assetsi
- 2/5
- Debt to equityi
- 3/5
- Price to earningsi
- 1/5
- Price to booki
- 1/5
Company press releases
Congressional disclosures
Senate
House
Market cap history
Not comparable with the headline: the provider's history counts about 282M shares, the headline 344.8M. Shown as the provider reports it. Shown from Oct 12, 2026: earlier points count a different number of shares and are left out.
Largest fund holders
| Fund | Weight | Shares held |
|---|---|---|
| VOO | 0.02% | 7.5M |
| VTI | 0.02% | 7.1M |
| VWNDX | 1.21% | 5.8M |
| RSP | 0.22% | 3.9M |
| 1655.T | 0.03% | 3.8M |
| IVV | 0.03% | 3.8M |
| SPY | 0.03% | 3.5M |
| VB | 0.1% | 3.2M |
| FXAIX | 0.02% | 3.1M |
| VO | 0.08% | 3M |
| VCPA.S | 0.06% | 2.8M |
| XLP | 0.94% | 2.5M |
Analyst track record
How the analysts covering TSN have done: ratings, price-target accuracy and the measured reaction after their calls.
| 12 months | 3 years | |
|---|---|---|
| Ratings | 71 | 174 |
| Analysts | 12 | 18 |
| Buy / hold / sell | 33 / 37 / 1 | 61 / 107 / 6 |
| Upgrades / downgrades / initiations | 3 / 1 / 2 | 7 / 3 / 8 |
| Price targets hit / missed | 10 / 56 (15%) | 76 / 87 (47%) |
| Avg. return after a rating (TipRanks) | -7.2% | -0.3% |
| Best / worst call | +14.2% / -21.1% | +59.9% / -21.1% |
After buy calls on this stock: median 21-day move +1.1% vs S&P 500 -1.3% (n = 58)
Most accurate on this stock
Share of an analyst's price targets on this stock that the price reached within 12 months (our measurement over the last 3 years, at least 8 targets). It describes past calls, not the odds of the current one.
- Alexia Burland HowardBernstein11% hit rate on this stock · 9 targets measuredHoldtarget $72.00Nov 17, 2026
- Benjamin TheurerBarclays6% hit rate on this stock · 18 targets measuredBuytarget $75.00Nov 17, 2026
Latest ratings
| Date | Analyst | Call | Target | |
|---|---|---|---|---|
| Nov 17, 2026 | Peter GalboBank of America SecuritiesNov 17, 2026 | HoldMaintained | $65.00↗ | article ↗ |
| Nov 17, 2026 | Andrew StrelzikBMO CapitalNov 17, 2026 | BuyMaintained | $75.00↗ | article ↗ |
| Nov 17, 2026 | Michael LaveryPiper SandlerNov 17, 2026 | BuyReiterated | $72.00↗ | article ↗ |
| Nov 17, 2026 | Alexia Burland HowardBernsteinNov 17, 2026 | HoldReiterated | $72.00↗ | article ↗ |
| Nov 17, 2026 | Benjamin TheurerBarclaysNov 17, 2026 | BuyMaintained | $75.00 |
Share of analysts per call each month (latest call per analyst within 180 days). Targets and closes in USD.
TipRanks data · computed Nov 18, 2026 · 71 ratings
Frequently asked questions
Where can I trade TSN perpetual futures?
Tyson Foods, Inc. (TSN) perpetual futures trade on one crypto venue: MEXC. PerpEquities shows its live price, funding rate, open interest and liquidity.
Can I trade TSN around the clock?
Yes. Unlike the underlying stock, TSN perpetuals trade 24/7 — including weekends and outside regular market hours.
What is the funding rate on TSN perpetuals?
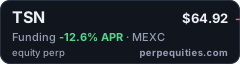
Right now the TSN perp funding rate is -12.6% annualized (one venue). A positive rate means longs pay shorts. PerpEquities shows the live rate and its history.
How does the TSN perp price compare to the Tyson Foods, Inc. stock?
The venue-median TSN perp mark is $65.2 versus a reference stock price of $65.2, a basis of 0.0%. Perps follow the stock through an index price; the gap widens when funding or liquidity diverge between venues.
What is a TSN perpetual future?
A TSN perpetual is a derivative that tracks the price of Tyson Foods, Inc. with no expiry date. It lets you take long or short exposure to Tyson Foods, Inc. on crypto venues, around the clock.
What is TSNUSDT perpetual?
TSNUSDT is the symbol most crypto exchanges use for the Tyson Foods, Inc. perpetual settled in USDT (Tether). It tracks the TSN share price through an index, trades 24/7 with leverage and never expires.
Embed this asset
<a href="https://perpequities.com/stocks/tsn-perp"><img src="https://perpequities.com/badge/tsn-perp.svg" width="240" height="64" alt="TSN perpetuals · perpequities.com" loading="lazy"></a>