
Equity · Consumer defensive
Molson Coors Beverage Company (TAP) perpetual futures
TAP perpetual futures on 1 crypto exchange – live perp price vs the stock, funding rate, open interest and where to trade TAPUSDT.
Molson Coors Beverage Company produces, markets and sells beer, flavored malt beverages, craft beers and ready-to-drink products across the Americas, Europe, the Middle East, Africa and Asia Pacific.
Price chart
Use the left and right arrow keys to inspect points on the chart.
Trading data
Perpetual market activity
1/1 live markets
Trading data
Perpetual market activity
Spot performance
Venue matrix
1 markets
Some venue links are sponsored. We may receive a commission, and eligible users may occasionally receive trading-fee discounts, at no additional cost to you.
| Trade | ||||||||||||
|---|---|---|---|---|---|---|---|---|---|---|---|---|
 Helix (Injective) | Trade | TAP/USDC | Trading | $40.85 | +3.6% APR +0.00042% every 1h | - | $0 | - | - | USDC | 12x |
Tradability
Execution quality
Entry cost and depth per venue at $1k–$100k
Tradability
Execution quality
Entry cost and depth per venue at $1k–$100kNo sufficient depth · 0 of 1 venues absorb $10k
No fresh book data: Helix (Injective)
Taker execution estimate incl. approx. fees - maker fills are not guaranteed.
Best venues for this underlying
Best liquidity
TAPTightest spread
-Highest volume
-Funding history
Stored venue snapshots by market
Funding history
Stored venue snapshots by marketNext catalyst
Catalysts
Next catalyst
Catalysts
No unusual perp activity right now.
Research data
Analysts, filings and peer context
Research data
Analysts, filings and peer context
Estimates
6Company events
6Peer comparison
Similar listed perpsRevenue mix
Latest annualAnalysts
Price targets in USD| Consensus rating | Hold |
|---|---|
| Average 12-month price target | $40.80 |
| 12-month target range (low – high) | $36 – $45 |
| Ratings in the provider's consensus | 37 |
Price targets as of 2026-11-15
Analyst rating history
Ratings| Month | Strong buy | Buy | Hold | Sell | Strong sell |
|---|---|---|---|---|---|
| Nov 2026 | 2 | 4 | 11 | 2 | 4 |
| Oct 2026 | 2 | 4 | 11 | 1 | 3 |
| Sep 2026 | 2 | 4 | 11 | 1 | 3 |
| Aug 2026 | 2 | 4 | 11 | 1 | 3 |
| Jul 2026 | 2 | 4 | 11 | 1 | 3 |
| Jun 2026 | 2 | 4 | 11 | 1 | 3 |
| May 2026 | 2 | 4 | 11 | 1 | 3 |
| Apr 2026 | 2 | 4 | 11 | 1 | 3 |
| Mar 2026 | 2 | 4 | 12 | 1 | 3 |
| Feb 2026 | 2 | 5 | 13 | 1 | 3 |
| Jan 2026 | 2 | 4 | 13 | 1 | 2 |
| Dec 2025 | 2 | 4 | 13 | 1 | 1 |
Ownership
Institutional · 2026-Q3Reference market activity
TAP-PERPPrice performance
11Insider activity
FY2026 Q3Insider transactions
25Molson Coors director Charles M. Herington received an award of 395 Class B common shares at $0.00 on 2026-09-30, bringing his holdings to 66,325 shares.
Director Christian P. Cocks received a 789-share award of Class B common stock on Sept 30, 2026, a grant at $0.00 and not an open-market purchase; he then held 10,805 shares.
Adolph Coors CO LLC filed a Form 3 as a 10% owner of Molson Coors, reporting holdings of 21,222,798 Class B and 2,520,000 Class A common shares plus 300,000 more Class B shares. No share transactions were reported.
Director Cocks Christian P received a 738-share award of Molson Coors Class B Common Stock at $0.00 on 2026-06-30, bringing his holding to 10,016 shares.
Award of 369 Class B common shares to director Charles M. Herington on June 30, 2026, at $0.00; he held 65,930 shares afterward.
Director Geoffrey E. Molson sold 1,245 Class B common shares of Molson Coors at $42.50 on May 21, 2026, leaving 9,871 shares owned.
Molson Coors director Riley H Sanford reported disposing of 1,345 Class B common shares at $41.68 each on 2026-05-18 under code F (tax withholding), leaving 48,697 shares owned.
Molson Coors director O'Sullivan Nessa had 610 Class B common shares withheld at $41.68 each for tax on May 18, 2026, leaving 27,017 shares owned, per a Form 4 filed May 20, 2026.
Director Molson Andrew Thomas held back 1,422 Class B common shares at $41.68 for tax withholding (code F), leaving 27,208 shares owned after the May 18, 2026 transaction.
Director Geoffrey E. Molson reported 1,422 Class B common shares disposed at $41.68 on May 18, 2026, coded F for tax withholding, leaving 11,116 shares owned.
Director Roger G. Eaton reported 610 Class B common shares disposed at $41.68 each for tax withholding (F-InKind), leaving 55,277 shares held.
Molson Coors director Winnefeld James A Jr received a grant of 3,976 Class B common shares at $0.00 under an A-Award, raising his holdings to 26,264 shares.
Director Leroy James Williams Jr. received a 3,976-share Class B Common Stock award (A) on May 6, 2026, at $0.00, bringing his holdings to 15,394 shares.
Director Timm Jill received a grant (A-Award) of 3,976 Class B Common Shares of Molson Coors at $0.00, bringing holdings to 10,968 shares. No open-market purchase occurred.
Director Riley H Sanford received an A-Award grant of 3,976 Class B Common shares of Molson Coors at $0.00, raising his holding to 50,042 shares.
Molson Coors director Nessa O'Sullivan received a 3,976-share grant of Class B common stock (transaction code A) on May 6, 2026, at $0.00, bringing her holdings to 27,627 shares.
Molson Coors director Geoffrey E. Molson received an award of 3,976 Class B common shares at $0.00 on 2026-05-06, bringing his holding to 12,538 shares.
Molson Coors CFO Tracey Joubert disposed of 11,728 Class B common shares at $43.66 on April 14, 2026, a tax withholding (code F), leaving 179,868 shares owned.
Director Molson Andrew Thomas received an award of 3,976 Class B Common shares at $0.00 on 2026-05-06, raising his holding to 28,630 shares.
Director Charles M. Herington received a grant of 3,976 Class B common shares of Molson Coors at $0.00 on May 6, 2026, raising his holding to 65,561 shares.
Director MaryLynn FergusonMchugh received a grant (Award, code A) of 3,976 Class B common shares of Molson Coors at $0.00, lifting her holding to 32,712 shares.
Molson Coors director Roger G. Eaton received a grant (A-Award) of 3,976 Class B Common Stock shares at $0.00 on 2026-05-06, raising his holdings to 55,887 shares. This is a compensation grant, not an open-market purchase.
Molson Coors director Coors Peter Joseph was awarded 3,976 Class B common shares on 2026-05-06 at $0.00 per share, bringing his holdings to 32,359 shares, per Form 4 filed 2026-05-08.
Filings
30 · Latest SEC filingsMolson Coors director Charles M. Herington received an award of 395 Class B common shares at $0.00 on 2026-09-30, bringing his holdings to 66,325 shares.
Director Christian P. Cocks received a 789-share award of Class B common stock on Sept 30, 2026, a grant at $0.00 and not an open-market purchase; he then held 10,805 shares.
Adolph Coors CO LLC filed a Form 3 as a 10% owner of Molson Coors, reporting holdings of 21,222,798 Class B and 2,520,000 Class A common shares plus 300,000 more Class B shares. No share transactions were reported.
Director Cocks Christian P received a 738-share award of Molson Coors Class B Common Stock at $0.00 on 2026-06-30, bringing his holding to 10,016 shares.
Award of 369 Class B common shares to director Charles M. Herington on June 30, 2026, at $0.00; he held 65,930 shares afterward.
Director Geoffrey E. Molson sold 1,245 Class B common shares of Molson Coors at $42.50 on May 21, 2026, leaving 9,871 shares owned.
Molson Coors director Riley H Sanford reported disposing of 1,345 Class B common shares at $41.68 each on 2026-05-18 under code F (tax withholding), leaving 48,697 shares owned.
Molson Coors director O'Sullivan Nessa had 610 Class B common shares withheld at $41.68 each for tax on May 18, 2026, leaving 27,017 shares owned, per a Form 4 filed May 20, 2026.
Director Molson Andrew Thomas held back 1,422 Class B common shares at $41.68 for tax withholding (code F), leaving 27,208 shares owned after the May 18, 2026 transaction.
Director Geoffrey E. Molson reported 1,422 Class B common shares disposed at $41.68 on May 18, 2026, coded F for tax withholding, leaving 11,116 shares owned.
Director Roger G. Eaton reported 610 Class B common shares disposed at $41.68 each for tax withholding (F-InKind), leaving 55,277 shares held.
Molson Coors director Winnefeld James A Jr received a grant of 3,976 Class B common shares at $0.00 under an A-Award, raising his holdings to 26,264 shares.
Director Leroy James Williams Jr. received a 3,976-share Class B Common Stock award (A) on May 6, 2026, at $0.00, bringing his holdings to 15,394 shares.
Director Timm Jill received a grant (A-Award) of 3,976 Class B Common Shares of Molson Coors at $0.00, bringing holdings to 10,968 shares. No open-market purchase occurred.
Director Riley H Sanford received an A-Award grant of 3,976 Class B Common shares of Molson Coors at $0.00, raising his holding to 50,042 shares.
Transcripts
PendingCompany news
Reuters, WSJ, Bloomberg and FT first, as far as our news provider delivers them; other publishers behind the second filter. Headlines link to the publisher.Company data
Company intelligence
Updated: Nov 15, 2026, 02:11 PM UTC
Company data
Company intelligence
Company profile
- Sector
- Consumer Defensive
- Industry
- Beverages - Alcoholic
- Chief executive
- Rahul Goyal
- Employees
- 16,200
- IPO date
- Jun 12, 1975
- Country
- US
- Exchange
- New York Stock Exchange
Rating factors
- Return on equityi
- 3/5
- Return on assetsi
- 3/5
- Debt to equityi
- 2/5
- Price to earningsi
- 4/5
- Price to booki
- 5/5
Company press releases
Congressional disclosures
Senate
House
Market cap history
Largest fund holders
| Fund | Weight | Shares held |
|---|---|---|
| IJR | 0.36% | 9.6M |
| XAW.TO | 0.01% | 9.6M |
| AFTY | 1.39% | 5.2M |
| VTI | 0.01% | 4.7M |
| VB | 0.07% | 3.3M |
| DFSV | 0.47% | 3.3M |
| VEIPX | 0.18% | 3.2M |
| DFAT | 0.33% | 2.6M |
| VECA.S | 0.05% | 2.5M |
| VBR | 0.12% | 2.2M |
| VXF | 0.07% | 1.8M |
| SPSM | 0.36% | 1.5M |
Analyst track record
How the analysts covering TAP have done: ratings, price-target accuracy and the measured reaction after their calls.
| 12 months | 3 years | |
|---|---|---|
| Ratings | 104 | 307 |
| Analysts | 21 | 26 |
| Buy / hold / sell | 23 / 58 / 23 | 82 / 174 / 51 |
| Upgrades / downgrades / initiations | 0 / 5 / 0 | 4 / 11 / 4 |
| Price targets hit / missed | 17 / 86 (17%) | 17 / 282 (6%) |
| Avg. return after a rating (TipRanks) | -8.2% | -22.7% |
| Best / worst call | +13.4% / -33.1% | +13.4% / -53.0% |
After buy calls on this stock: not enough measured cases yet
Latest ratings
| Date | Analyst | Call | Target | |
|---|---|---|---|---|
| Nov 9, 2026 | Eric SerottaMorgan StanleyNov 9, 2026 | HoldReiterated | $42.00↗ | article ↗ |
| Nov 9, 2026 | Drew LevineJ.P. MorganNov 9, 2026 | SellDowngraded | $37.00↗ | article ↗ |
| Nov 6, 2026 | Peter GromUBSNov 6, 2026 | HoldMaintained | $44.00↗ | article ↗ |
| Nov 6, 2026 | Michael LaveryPiper SandlerNov 6, 2026 | HoldMaintained | $43.00↗ | article ↗ |
| Nov 6, 2026 | Peter GalboBank of America SecuritiesNov 6, 2026 | SellReiterated | $36.00↗ | article ↗ |
Share of analysts per call each month (latest call per analyst within 180 days). Targets and closes in USD.
TipRanks data · computed Nov 14, 2026 · 104 ratings
Frequently asked questions
Where can I trade TAP perpetual futures?
Molson Coors Beverage Company (TAP) perpetual futures trade on one crypto venue: Helix (Injective). PerpEquities shows its live price, funding rate, open interest and liquidity.
Can I trade TAP around the clock?
Yes. Unlike the underlying stock, TAP perpetuals trade 24/7 — including weekends and outside regular market hours.
What is the funding rate on TAP perpetuals?
Right now the TAP perp funding rate is +3.6% annualized (one venue). A positive rate means longs pay shorts. PerpEquities shows the live rate and its history.
How does the TAP perp price compare to the Molson Coors Beverage Company stock?
The venue-median TAP perp mark is $40.9 versus a reference stock price of $40.9, a basis of 0.0%. Perps follow the stock through an index price; the gap widens when funding or liquidity diverge between venues.
What is a TAP perpetual future?
A TAP perpetual is a derivative that tracks the price of Molson Coors Beverage Company with no expiry date. It lets you take long or short exposure to Molson Coors Beverage Company on crypto venues, around the clock.
What is TAPUSDT perpetual?
TAPUSDT is the symbol most crypto exchanges use for the Molson Coors Beverage Company perpetual settled in USDT (Tether). It tracks the TAP share price through an index, trades 24/7 with leverage and never expires.
Embed this asset
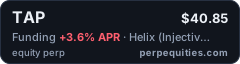
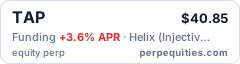
<a href="https://perpequities.com/stocks/tap-perp"><img src="https://perpequities.com/badge/tap-perp.svg" width="240" height="64" alt="TAP perpetuals · perpequities.com" loading="lazy"></a>