
Equity · Energy
Diamondback Energy, Inc. (FANG) perpetual futures
FANG perpetual futures on 2 crypto exchanges – live perp price vs the stock, funding rate, open interest and where to trade FANGUSDT.
Diamondback Energy is an independent oil and natural gas company focused on acquiring, developing, exploring and producing onshore unconventional reserves, mainly in the Permian Basin of West Texas and New Mexico.
Price chart
Use the left and right arrow keys to inspect points on the chart.
Trading data
Perpetual market activity
2/3 live markets
Trading data
Perpetual market activity
Spot performance
Venue matrix
3 markets
Some venue links are sponsored. We may receive a commission, and eligible users may occasionally receive trading-fee discounts, at no additional cost to you.
 MEXC
 Extended
 BingX
Tradability
Execution quality
Entry cost and depth per venue at $1k–$100k
Tradability
Execution quality
Entry cost and depth per venue at $1k–$100kThin liquidity · 1 of 2 venues absorb $10k · Typical cost: +82.5 bps
Cheapest execution: MEXC · +82.5 bps
No fresh book data: Extended
Taker execution estimate incl. approx. fees - maker fills are not guaranteed.
Best venues for this underlying
Best liquidity
FANGTightest spread
FANGHighest volume
FANGFunding history
Stored venue snapshots by market
Funding history
Stored venue snapshots by marketNext catalyst
Catalysts
Next catalyst
Catalysts
No unusual perp activity right now.
Research data
Analysts, filings and peer context
Research data
Analysts, filings and peer context
Estimates
6Company events
6Peer comparison
Similar listed perpsRevenue mix
Latest annualAnalysts
Price targetsAnalyst rating history
RatingsOwnership
Institutional · 2026-Q3Reference market activity
FANG-PERPPrice performance
11Insider activity
FY2026 Q4Insider transactions
25Director Meloy Charles Alvin sold 33,333 shares of Diamondback Energy common stock in 3 open-market transactions at $183.17-$184.99, leaving 759,864 shares owned.
SGF FANG Holdings, LP, a 10% owner, sold 9,079,675 common shares of Diamondback Energy at $205.26 in one open-market sale on 2026-09-16, leaving 64,957,047 shares owned.
SGF FANG Holdings, LP, a 10% owner of Diamondback Energy, sold 9,079,675 common shares on the open market at $205.26 each on 2026-09-16, leaving 64,957,047 shares owned.
Diamondback Energy officer Matt Zmigrosky sold 1,326 common shares on the open market (S-Sale) at $212.5554 per share on 2026-09-15, leaving 36,705 shares owned.
Diamondback Energy officer Teresa L. Dick sold 5,000 common shares in an open-market sale at $210 per share on Sept 15, 2026, leaving 75,755 shares owned.
Director Meloy Charles Alvin reported four gift (G) transactions in Diamondback Energy common stock on Sept 15-16, 2026: 37,500 shares disposed and 37,500 shares acquired, all at $0.00.
Director Travis D. Stice sold 75,000 shares of Diamondback Energy common stock in one open-market transaction at $204.3103 per share, leaving 49,727 shares owned.
Diamondback Energy officer Zmigrosky Matt had 861 shares of Common Stock withheld for taxes (F-InKind) at $202.63 per share on Sep 10, 2026, leaving 38,031 shares owned.
Diamondback Energy officer Barkmann Albert had 682 common shares withheld for taxes (F-InKind) at $202.63 on Sep 10, 2026, leaving 23,889 shares owned.
Diamondback Energy CEO Matthew Van't Hof sold 10,000 common shares on 2026-08-20 at $214.64-$215.056, leaving 115,940 shares owned directly.
Diamondback Energy officer Daniel N. Wesson sold 7,500 common shares at $215.2072 on Aug 20, 2026, leaving 70,789 shares owned.
Director Mark Lawrence Plaumann sold 1,000 common shares of Diamondback Energy at $210.5766 per share on Aug 21, 2026, leaving 12,437 shares owned.
Diamondback Energy officer Zmigrosky Matt sold 2,500 common shares on the open market at $202.7721, leaving 38,892 shares owned.
CFO Jere W. Thompson III sold 500 shares of Diamondback Energy common stock on the open market at $204.1401 per share on Aug 14, 2026, leaving 18,475 shares owned after the sale.
Diamondback Energy CEO Matthew Kaes Van't Hof sold 5,000 common shares on the open market at $202.4632 on Aug 11, 2026, leaving 125,940 shares held.
Director Charles Alvin Meloy sold 33,333 Diamondback Energy common shares in 4 open-market transactions on 2026-08-03 at prices from $197.0581 to $199.4439, leaving 818,197 shares owned.
Filings
31 · Latest SEC filingsDirector Meloy Charles Alvin sold 33,333 shares of Diamondback Energy common stock in 3 open-market transactions at $183.17-$184.99, leaving 759,864 shares owned.
SGF FANG Holdings, LP, a 10% owner, sold 9,079,675 common shares of Diamondback Energy at $205.26 in one open-market sale on 2026-09-16, leaving 64,957,047 shares owned.
Director Meloy Charles Alvin reported four gift (G) transactions in Diamondback Energy common stock on Sept 15-16, 2026: 37,500 shares disposed and 37,500 shares acquired, all at $0.00.
SGF FANG Holdings, LP, a 10% owner of Diamondback Energy, sold 9,079,675 common shares on the open market at $205.26 each on 2026-09-16, leaving 64,957,047 shares owned.
Diamondback Energy officer Matt Zmigrosky sold 1,326 common shares on the open market (S-Sale) at $212.5554 per share on 2026-09-15, leaving 36,705 shares owned.
Diamondback Energy officer Teresa L. Dick sold 5,000 common shares in an open-market sale at $210 per share on Sept 15, 2026, leaving 75,755 shares owned.
Director Travis D. Stice sold 75,000 shares of Diamondback Energy common stock in one open-market transaction at $204.3103 per share, leaving 49,727 shares owned.
Diamondback Energy officer Zmigrosky Matt had 861 shares of Common Stock withheld for taxes (F-InKind) at $202.63 per share on Sep 10, 2026, leaving 38,031 shares owned.
Diamondback Energy officer Barkmann Albert had 682 common shares withheld for taxes (F-InKind) at $202.63 on Sep 10, 2026, leaving 23,889 shares owned.
Diamondback Energy officer Daniel N. Wesson sold 7,500 common shares at $215.2072 on Aug 20, 2026, leaving 70,789 shares owned.
Director Mark Lawrence Plaumann sold 1,000 common shares of Diamondback Energy at $210.5766 per share on Aug 21, 2026, leaving 12,437 shares owned.
Diamondback Energy CEO Matthew Van't Hof sold 10,000 common shares on 2026-08-20 at $214.64-$215.056, leaving 115,940 shares owned directly.
Diamondback Energy officer Zmigrosky Matt sold 2,500 common shares on the open market at $202.7721, leaving 38,892 shares owned.
CFO Jere W. Thompson III sold 500 shares of Diamondback Energy common stock on the open market at $204.1401 per share on Aug 14, 2026, leaving 18,475 shares owned after the sale.
Diamondback Energy CEO Matthew Kaes Van't Hof sold 5,000 common shares on the open market at $202.4632 on Aug 11, 2026, leaving 125,940 shares held.
Director Charles Alvin Meloy sold 33,333 Diamondback Energy common shares in 4 open-market transactions on 2026-08-03 at prices from $197.0581 to $199.4439, leaving 818,197 shares owned.
Diamondback Energy CEO Matthew Van't Hof disposed of 2,674 shares of common stock as a gift on June 17, 2026, leaving 130,940 shares owned after the transaction.
Transcripts
Earnings callsFY2026 Q32026-11-03
Earnings calls
AI summary
positiveDiamondback Energy held its Q3 2026 earnings call mostly in Q&A format, with CEO Kaes Van't Hof referencing a longer shareholder letter on Permian mega themes. Management said the company reinvests roughly 30-32% of cash flow, well below super majors, and attributed that to capital allocation, low cost structure and volatility protection. Executives discussed Barnett results and the move toward full-field development, improving recovery through completions and chemical EOR, staying a Permian-focused operator rather than diversifying, balance sheet and buyback flexibility, LNG and power/data center opportunities, and AI-enabled production optimization. Management did not issue formal 2027 guidance, saying plans would come in February, while noting the company remains in 'green light' mode.
Key takeaways
- Chief Executive Kaes Van't Hof said Diamondback's reinvestment rate is about 30-32%, below super majors, attributing it to drilling the best projects first, the lowest cost structure in the basin, and a desire to protect against commodity volatility.
- Management is focused on Permian durability into the 2030s, citing recovery of roughly 10% of oil in place today and potential to reach 11% in the next couple of years through completions and chemical EOR.
- Van't Hof said Diamondback intends to remain a Permian-focused company, arguing investors would rather see capital spent on items like surfactant tests than on exploration outside the basin.
- The Barnett is moving from delineation into full-field development; Al Barkmann said at $850-$900 per foot, Barnett returns and capital efficiency would exceed the core program.
- Management reiterated it remains in 'green light' mode and said a formal 2027 plan will be provided in February; running 19-20 rigs and five frac crews is the base case, with footage relatively flat versus this year.
Financial highlights
- Reinvestment rate was described as 32% for the year and roughly 30% on the strip, below super majors.
- Diamondback corporate is expected to pay about $2 billion of cash taxes this year, according to Van't Hof.
- Management said the base dividend remains well protected below $40 a barrel oil.
- Fourth-quarter CapEx was guided essentially the same as the third quarter.
Guidance
- Management said it can probably hold oil production flat at the higher end of the range going forward while offsetting some inflation with efficiencies.
- Growth in 2027 is 'still very much TBD based on the macro'; if the company wants to grow, it would have to spend a little more than the Q4 range.
- A formal 2027 plan will be provided in February; at $100 oil, CapEx would probably be a little higher.
- Base case is to run 19-20 rigs and five frac crews consistently, producing relatively flat footage versus this year.
Q&A themes
- Reinvestment rate and capital allocation flexibility
- Barnett results, full-field development and well-cost targets
- Permian focus versus diversification, and recovery/EOR upside
- LNG, power/data center opportunities and balance sheet/buyback strategy
Risks
- Management flagged service-side inflation risk, particularly if an inflation cycle emerges at $100 oil, and said it will try to offset it through execution and procurement.
- Van't Hof said front-month commodity volatility remains high and public-to-public or large-scale M&A is harder to complete in this environment.
- Barnett development remains early, with limited data; management said completion intensity and full-section results will determine how the program evolves.
FY2026 Q22026-08-03
Earnings calls
AI summary
positiveOn its Q2 2026 call, Diamondback discussed a macro view that global oil and product inventories are draining and will need to be refilled, absent permanent demand destruction. Management said this skews the company toward growing production versus holding flat, noting 2026 output is up roughly 4% from the start of the year after responding to March price signals. The company cited operational improvements including well productivity, longer laterals, lower drilling costs in the Barnett and early EOR results. It provided updates on gas marketing and egress, a proposed behind-the-meter power project at Bryant Ranch, and a flexible return-of-capital approach that removed a minimum free cash flow return commitment last quarter. Management also said it reduced net debt by $1.6 billion and allocated some capital to buybacks in Q2 and Q3. No formal financial guidance figures were provided on the call beyond general cost and run-rate commentary.
Key takeaways
- Management believes global oil and product inventories are draining and will need to be refilled, absent permanent demand destruction, supporting a longer-term bid for oil.
- Diamondback responded to March price signals by increasing 2026 production, now up roughly 4% versus the start of the year, and is considering low single-digit organic growth for 2027 while running 5 frac crews.
- The company removed its minimum free cash flow return commitment last quarter to preserve flexibility; it reduced net debt by $1.6 billion and bought back some stock in Q2 and Q3.
- Operational gains cited include longer laterals, electric frac fleets, improved gas marketing and first-quarter continuous pumping averaging over 21 hours per day.
- Barnett development is ramping, with drilling costs approaching $400 per foot, and the first 4-well Spanish Trail pad drilled and to be completed in the next couple of months.
Financial highlights
- Net debt was reduced by $1.6 billion, which management translated to $5.60 per share of value shifted from debt to equity holders.
- LOE dollars were flat quarter-over-quarter, with the LOE decline below $6 per barrel driven by the production beat.
- Q2 bolt-on acquisitions, net of divestitures, were approximately $385 million with very little associated production.
- Non-D&C spend was cited at $600 million this year, expected to be close with slight upside next year as Barnett infrastructure is built.
Guidance
- A quarterly capital run rate of around $1 billion to a little over $1 billion is viewed as reasonable to hold production flat, based on what is seen today.
- LOE is expected to remain around $6 per barrel or a little higher in the back half of the year, with possible volume-driven upside.
- Casing cost inflation in the back half of the year is estimated at a little over 1% of total well cost, which the company believes can be offset with efficiency gains.
- Non-D&C spend is expected to rise slightly in 2027, with mix shifting toward Barnett infrastructure such as new batteries.
Q&A themes
- Macro oil inventory outlook and the decision to grow rather than hold production flat
- Well productivity and capital allocation, including lateral length, completion design and U-turn wells
- Gas marketing, Waha egress, LNG strategy and the Bryant Ranch behind-the-meter power/data center project
- Return of capital, balance sheet priorities and buyback framework
Risks
- Management flagged uncertainty in global oil markets and a breakdown in the inventory-price relationship, with heightened volatility expected.
- Oilfield service inflation is visible in consumables, including higher casing prices in the back half of the year and potential pressure if U.S. rig counts continue rising.
- The Bryant Ranch power project remains subject to ERCOT Batch Zero eligibility decisions and definitive documentation with a hyperscaler.
Company news
Reuters, WSJ, Bloomberg and FT first, as far as our news provider delivers them; other publishers behind the second filter. Headlines link to the publisher.Company data
Company intelligence
Updated: Nov 9, 2026, 10:45 AM UTC
Company data
Company intelligence
Company profile
- Sector
- Energy
- Industry
- Oil & Gas Exploration & Production
- Chief executive
- Matthew Kaes Van't Hof
- Employees
- 1,762
- IPO date
- Oct 12, 2012
- Country
- US
- Exchange
- NASDAQ Global Select
Rating factors
- Return on equityi
- 2
- Return on assetsi
- 3
- Debt to equityi
- 3
- Price to earningsi
- 1
- Price to booki
- 4
Company press releases
Congressional disclosures
Senate
House
Market cap history
Largest fund holders
| Fund | Weight | Shares held |
|---|---|---|
| VCPA.S | 0.16% | 7.4M |
| VTI | 0.05% | 6.7M |
| VEIPX | 1.87% | 6.6M |
| QQQ | 0.24% | 5.9M |
| VOO | 0.06% | 5.4M |
| VO | 0.38% | 4.5M |
| XLE | 1.96% | 4.4M |
| VWIAX | 1.14% | 2.8M |
| IVV | 0.06% | 2.7M |
| XAW.TO | 0.03% | 2.7M |
| 1657.T | 0.04% | 2.7M |
| XUS-U.TO | 0.06% | 2.7M |
Analyst track record
How the analysts covering FANG have done: ratings, price-target accuracy and the measured reaction after their calls.
| 12 months | 3 years | |
|---|---|---|
| Ratings | 197 | 584 |
| Analysts | 36 | 41 |
| Buy / hold / sell | 182 / 15 / 0 | 533 / 50 / 1 |
| Upgrades / downgrades / initiations | 1 / 5 / 5 | 7 / 6 / 18 |
| Price targets hit / missed | 28 / 157 (15%) | 114 / 436 (21%) |
| Avg. return after a rating (TipRanks) | -14.5% | -11.3% |
| Best / worst call | +13.3% / -33.5% | +23.4% / -37.4% |
After buy calls on this stock: median 21-day move +1.3% vs S&P 500 -2.0% (n = 534)
Most accurate on this stock
Share of an analyst's price targets on this stock that the price reached within 12 months (our measurement over the last 3 years, at least 8 targets). It describes past calls, not the odds of the current one.
- Subash ChandraStoneX77% hit rate on this stock · 13 targets measuredHoldtarget $195Mar 5, 2026
- Leo MarianiRoth MKM71% hit rate on this stock · 17 targets measuredBuytarget $223Nov 10, 2026
- Arun JayaramJ.P. Morgan67% hit rate on this stock · 18 targets measuredBuytarget $263Nov 5, 2026
Latest ratings
TipRanks data · computed Nov 10, 2026 · 197 ratings
Frequently asked questions
Where can I trade FANG perpetual futures?
Diamondback Energy, Inc. (FANG) perpetual futures trade on 2 crypto venues, including MEXC, Extended. PerpEquities compares them by live price, funding rate, open interest and liquidity.
Can I trade FANG around the clock?
Yes. Unlike the underlying stock, FANG perpetuals trade 24/7 — including weekends and outside regular market hours.
What is the funding rate on FANG perpetuals?
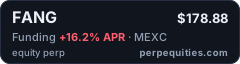
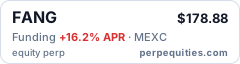
Right now the FANG perp funding rate is +10.3% annualized (venue median), ranging from +4.4% to +16.2% across 2 venues. A positive rate means longs pay shorts. PerpEquities shows the live rate and its history for every venue.
How does the FANG perp price compare to the Diamondback Energy, Inc. stock?
The venue-median FANG perp mark is $178.7 versus a reference stock price of $179.2, a basis of -0.3%. Perps follow the stock through an index price; the gap widens when funding or liquidity diverge between venues.
What is a FANG perpetual future?
A FANG perpetual is a derivative that tracks the price of Diamondback Energy, Inc. with no expiry date. It lets you take long or short exposure to Diamondback Energy, Inc. on crypto venues, around the clock.
What is FANGUSDT perpetual?
FANGUSDT is the symbol most crypto exchanges use for the Diamondback Energy, Inc. perpetual settled in USDT (Tether). It tracks the FANG share price through an index, trades 24/7 with leverage and never expires.
Embed this asset
<a href="https://perpequities.com/stocks/fang-perp"><img src="https://perpequities.com/badge/fang-perp.svg" width="240" height="64" alt="FANG perpetuals · perpequities.com" loading="lazy"></a>