
Equity · Healthcare
Waters Corporation (WAT) perpetual futures
WAT perpetual futures on 1 crypto exchange – live perp price vs the stock, funding rate, open interest and where to trade WATUSDT.
Waters Corporation makes analytical instruments, including liquid chromatography and mass spectrometry systems, plus thermal analysis, rheometry and calorimetry tools, and related software and services for laboratories.
Price chart
Use the left and right arrow keys to inspect points on the chart.
Trading data
Perpetual market activity
1/2 live markets
Trading data
Perpetual market activity
Spot performance
Venue matrix
2 markets
Some venue links are sponsored. We may receive a commission, and eligible users may occasionally receive trading-fee discounts, at no additional cost to you.
 MEXC
 BingX
Tradability
Execution quality
Entry cost and depth per venue at $1k–$100k
Tradability
Execution quality
Entry cost and depth per venue at $1k–$100kNo sufficient depth · 0 of 1 venues absorb $10k
No fresh book data: MEXC
Taker execution estimate incl. approx. fees - maker fills are not guaranteed.
Best venues for this underlying
Best liquidity
WATTightest spread
WATHighest volume
WATFunding history
Stored venue snapshots by market
Funding history
Stored venue snapshots by marketNext catalyst
Catalysts
Next catalyst
Catalysts
No unusual perp activity right now.
Research data
Analysts, filings and peer context
Research data
Analysts, filings and peer context
Estimates
6Company events
6Peer comparison
Similar listed perpsRevenue mix
Latest annualAnalysts
Price targets in USD| Consensus rating | Buy |
|---|---|
| Average price target | $470 |
| Target range (low – high) | $400 – $535 |
| Ratings counted | 37 |
Analyst rating history
Ratings| Month | Strong buy | Buy | Hold | Sell | Strong sell |
|---|---|---|---|---|---|
| Nov 2026 | 3 | 15 | 5 | 0 | 1 |
| Oct 2026 | 3 | 15 | 6 | 0 | 1 |
| Sep 2026 | 3 | 15 | 7 | 0 | 1 |
| Aug 2026 | 3 | 14 | 9 | 0 | 1 |
| Jul 2026 | 3 | 13 | 9 | 0 | 0 |
| Jun 2026 | 2 | 13 | 9 | 0 | 0 |
| May 2026 | 2 | 12 | 9 | 0 | 0 |
| Apr 2026 | 2 | 12 | 11 | 0 | 0 |
| Mar 2026 | 2 | 10 | 12 | 0 | 0 |
| Feb 2026 | 1 | 10 | 12 | 0 | 0 |
| Jan 2026 | 0 | 9 | 11 | 0 | 0 |
| Dec 2025 | 0 | 6 | 11 | 0 | 0 |
Ownership
Institutional · 2026-Q3Reference market activity
WAT-PERPPrice performance
11Insider activity
FY2026 Q3Insider transactions
25Waters officer Conly D Steven filed an initial Form 3 on Nov 6, 2026, disclosing 10 holdings from Oct 29, 2026: 6,030 common shares, 8 stock appreciation rights at $411.85-$464.50 and one stock option at $319.44. All rows report 0 shares transacted; no purchases or sales were reported.
Waters Corporation director Heather Knight received a grant of 57 common shares (code A-Award, not a purchase) on 2026-09-30, bringing her holdings to 1,338 shares.
Waters Corporation director Jiang Wei received 57 shares of common stock via an award (code A), a grant rather than an open-market purchase, bringing holdings to 3,630 shares after.
Waters Corporation officer Wu Tong filed a Form 3 on 2026-08-31 reporting no shares and no transactions; the single listed row shows 0 shares of common stock at $0.00.
Waters director Christopher A. Kuebler exercised options on 3,626 common shares at $136.43 and sold the same 3,626 shares at $397.94, leaving 17,808 shares owned.
Waters Corporation director Heather Knight received an award of 63 common shares on 2026-06-30 at $0.00, a compensation grant (code A), not an open-market purchase, and held 1,281 shares afterward.
Director Jiang Wei received an award of 67 shares of Waters Corporation common stock on June 30, 2026, at $0.00 per share, bringing their holdings to 3,573 shares.
Waters officer Robert L. Carpio III reported disposing of 189 common shares at $369.18 each on 2026-06-24, coded F-InKind for tax withholding, leaving 3,426 shares owned.
Waters Corporation (WAT) CFO Chaubal Amol had 239 common shares withheld for taxes at $352.21 on 2026-05-12, leaving 7,623 shares held.
Waters officer Bennett Jianqing disposed of 302 common shares at $304.09 on 2026-04-06 under code F (tax withholding), leaving 6,532 shares owned.
Waters Corp director Jiang Wei received an award of 64 common shares at $0.00 and now owns 3,505 shares. The grant was reported on a Form 4 filed 2026-04-02.
Waters Corporation director Knight Heather received an award of 68 common shares on 2026-03-31, bringing her holdings to 1,218 shares.
Director Jiang Wei bought 500 shares of Waters Corporation common stock on the open market on 2026-03-16 at $289.46 per share (a P-Purchase), bringing holdings to 3,441 shares. Form 4 filed 2026-03-18.
Director Richard H. Fearon bought 1,000 shares of Waters Corporation common stock on March 6, 2026 at $306.34 per share, an open-market purchase, leaving him with 3,302 shares.
Filings
30 · Latest SEC filingsWaters officer Conly D Steven filed an initial Form 3 on Nov 6, 2026, disclosing 10 holdings from Oct 29, 2026: 6,030 common shares, 8 stock appreciation rights at $411.85-$464.50 and one stock option at $319.44. All rows report 0 shares transacted; no purchases or sales were reported.
Waters Corporation director Heather Knight received a grant of 57 common shares (code A-Award, not a purchase) on 2026-09-30, bringing her holdings to 1,338 shares.
Waters Corporation director Jiang Wei received 57 shares of common stock via an award (code A), a grant rather than an open-market purchase, bringing holdings to 3,630 shares after.
Waters Corporation officer Wu Tong filed a Form 3 on 2026-08-31 reporting no shares and no transactions; the single listed row shows 0 shares of common stock at $0.00.
Waters director Christopher A. Kuebler exercised options on 3,626 common shares at $136.43 and sold the same 3,626 shares at $397.94, leaving 17,808 shares owned.
Director Jiang Wei received an award of 67 shares of Waters Corporation common stock on June 30, 2026, at $0.00 per share, bringing their holdings to 3,573 shares.
Waters Corporation director Heather Knight received an award of 63 common shares on 2026-06-30 at $0.00, a compensation grant (code A), not an open-market purchase, and held 1,281 shares afterward.
Waters officer Robert L. Carpio III reported disposing of 189 common shares at $369.18 each on 2026-06-24, coded F-InKind for tax withholding, leaving 3,426 shares owned.
Waters Corporation (WAT) CFO Chaubal Amol had 239 common shares withheld for taxes at $352.21 on 2026-05-12, leaving 7,623 shares held.
Waters officer Bennett Jianqing disposed of 302 common shares at $304.09 on 2026-04-06 under code F (tax withholding), leaving 6,532 shares owned.
Waters Corp director Jiang Wei received an award of 64 common shares at $0.00 and now owns 3,505 shares. The grant was reported on a Form 4 filed 2026-04-02.
Waters Corporation director Knight Heather received an award of 68 common shares on 2026-03-31, bringing her holdings to 1,218 shares.
Transcripts
Earnings callsFY2026 Q32026-11-03
Earnings calls
AI summary
positiveWaters reported Q3 FY2026 total as-reported revenue of $1.767 billion, comprising $871 million of organic revenue (up 9% as reported, 10% constant currency) and $896 million from Waters Bioscience and Waters Diagnostic Solutions (up 1% reported). Adjusted EPS rose 21% to $4.10, $0.05 above the high end of guidance, and orders outpaced sales by approximately $20 million. Management raised full-year 2026 revenue guidance by $43 million at the midpoint and lifted adjusted EPS guidance to $14.60-$14.70. For Q4, guidance calls for organic constant currency growth of 7%-9%, roughly 9%-11% on a days-adjusted basis, and approximately 10% reported growth for acquired businesses. For 2027, Waters framed a starting assumption of high single-digit growth for legacy Waters, mid-single digits for legacy BD and mid-single-digit-plus combined organic growth, with 100 basis points of adjusted operating margin expansion to 29.2% and low-teens adjusted EPS growth, with mid-teens as the upside case.
Key takeaways
- Organic revenue grew 10% constant currency, at the high end of guidance, with orders exceeding sales by about $20 million.
- Analytical Sciences grew 9% constant currency, led by chemistry up 12%, instruments up 10% and service up 8%.
- Biosciences grew 2% reported as flow reagents rose 8% and China returned to positive growth for the first time in 10 quarters.
- Advanced Diagnostics grew 2% reported; Diagnostic Solutions was flat as planned, while the organic clinical business grew 18% constant currency.
- Management cited pharma reshoring, AI-driven demand, China improvement and semiconductor/data center testing as incremental growth vectors not included in the 2027 starting framework.
Financial highlights
- Q3 total as-reported revenue was $1.767 billion; organic revenue was $871 million and Biosciences/Diagnostic Solutions contributed $896 million.
- Adjusted EPS grew 21% to $4.10; GAAP diluted EPS was $0.82.
- Adjusted gross margin was 55.8% and adjusted operating margin was 30.1%.
- Free cash flow was $68 million after approximately $81 million of integration-related costs and $240 million of timing items.
Guidance
- FY2026 organic constant currency growth guidance raised 140 basis points at the midpoint to 9.1%-9.7%; total 2026 reported revenue expected at approximately $6.479-$6.497 billion, a $43 million raise at the midpoint.
- FY2026 adjusted EPS guidance raised to $14.60-$14.70, representing 11%-12% year-over-year growth and 13%-14% in constant currency; adjusted EBIT margin of 28.2%, net interest expense of $196 million and a 15.4% tax rate.
- Q4 2026 guidance: organic constant currency growth of 7%-9%, total reported revenue of $1.801-$1.819 billion and adjusted EPS of $4.58-$4.68.
- Initial 2027 framework: mid-single-digit-plus combined organic growth (legacy Waters high single digits, legacy BD mid-single digits), adjusted operating margin of 29.2% and low-teens adjusted EPS growth, with mid-teens as the upside case.
Q&A themes
- Levers that could move 2027 growth above the mid-single-digit-plus starting point, including pricing, new products, reshoring, AI and China.
- Whether AI-driven demand can be quantified as incremental revenue, with management saying it is too early to size.
- 2027 margin bridge including the first six weeks of BD ownership and cost synergies versus reinvestment.
- Free cash flow trajectory and the phasing of integration costs, BD receivables and inventory reduction.
Risks
- Q4 guidance assumes no budget flush and reflects four fewer selling days in the quarter.
- China diagnostics faced DRG headwinds that diluted segment growth by approximately 200 basis points before annualizing into the baseline in Q4.
- Free cash flow in 2026 was affected by integration and SAP-related costs and about $240 million of timing items expected to normalize in 2027.
FY2026 Q22026-08-04
Earnings calls
AI summary
positiveWaters reported Q2 2026 total as-reported revenue of $1.645 billion, comprising $828 million of organic revenue and $817 million from the acquired Biosciences and Diagnostic Solutions businesses. Organic revenue grew 7% as reported and 9% in constant currency, about 100 basis points above the high end of the currency guidance range, with orders outpacing sales. Acquired businesses grew 4% on a reported basis versus the prior year comparable period and exceeded guidance by $15 million. Adjusted EPS was $3.05, at the high end of guidance, while GAAP diluted loss per share was $1.39 due to acquisition-related purchase accounting charges. Management raised every component of full-year 2026 guidance and cited completed cost actions of $75 million in 2026 and approximately $200 million of expected run-rate savings.
Key takeaways
- Organic revenue grew 9% in constant currency, with instruments up 8%, chemistry up 10% and service up 9% in Analytical Sciences.
- Analytical Sciences pharma grew 11% and academic/government grew 11%; industrial grew 1% as chemical analysis softness offset double-digit PFAS growth.
- Biosciences grew 3% as reported, improving 400 basis points from Q1; excluding China it grew 5%, and Flow Clinical grew 8% with mid-teens growth outside China.
- Advanced Diagnostics grew 7% as reported, with Diagnostic Solutions up 5% and the Clinical Business Unit up 15% as reported and 14% constant currency.
- The 180-day plan is delivering: 90 basis points of net price realization in acquired businesses in Q2, targeting 150 basis points, alongside China export license improvements and reagent rental compliance remediation.
Financial highlights
- Total company as-reported revenue was $1.645 billion; organic revenue was $828 million, up 7% as reported and 9% in constant currency.
- Biosciences and Diagnostic Solutions revenue was $817 million, up 4% reported versus the prior year comparable period, led by 6% growth outside China.
- Total company adjusted gross margin was 54% and adjusted operating margin was 25%; tax rate was 15.6% and net interest expense was $55 million.
- Free cash flow was $202 million after approximately $21 million in severance payments and $27 million of integration cost payments; net cash settlement due to BD was $157 million at end of June.
Guidance
- Full-year 2026 organic constant currency revenue growth raised to 7% to 9%, with FX a headwind of about 60 basis points; organic reported revenue of $3.37 billion to $3.431 billion.
- Biosciences and Diagnostic Solutions 2026 reported revenue expected at approximately $3.045 billion, raised $10 million net (underlying improvement of $25 million offset by $15 million FX); total 2026 reported revenue of approximately $6.415 billion to $6.476 billion.
- Full-year adjusted EPS guidance of $14.45 to $14.65, representing 10% to 12% growth as reported and 12% to 14% in constant currency; adjusted EBIT margin of 28.2%.
- Q3 2026 guidance: organic constant currency growth of 8% to 10%, organic reported revenue of $850 million to $867 million, acquired business revenue of approximately $895 million, total revenue of $1.745 billion to $1.762 billion, and adjusted EPS of $3.95 to $4.05.
Q&A themes
- Sustainability of the acquired-business acceleration and how to reconcile Q3/Q4 growth math, including BD fiscal-year trade inventory dynamics and the expectation to exit 2026 at 6% or better.
- Pricing execution in the acquired businesses, including deal desk implementation, the path from 90 basis points to 150 basis points, and reagent rental contract compliance.
- Flow cytometry turnaround: China localization timing, export license approvals, leadership change, and the FACSDiscover A7 launch set for September 15.
- Cost actions and margin trajectory, including the $50 million Q4 cost benefit as a starting point for 2027 and the 100-basis-point annual margin expansion outlook.
Risks
- Foreign exchange is a headwind: about 150 basis points adverse to Q2 organic revenue and roughly $0.25 of EPS absorbed by a stronger U.S. dollar, limiting the full-year guidance raise to $0.05.
- China remains a drag in diagnostics and Flow Clinical: China declined 13% in microbiology and 20% in Flow Clinical due to DRG constraints and lack of localized product portfolio.
- Pharma guidance for Q4 implies about 4% constant currency organic growth at the midpoint, below recent seasonal patterns, with approximately 3 fewer working days translating to a 1% to 1.5% headwind.
Company news
Reuters, WSJ, Bloomberg and FT first, as far as our news provider delivers them; other publishers behind the second filter. Headlines link to the publisher.No articles from Reuters, WSJ, Bloomberg or FT for this company in our feed.
Company data
Company intelligence
Updated: Nov 10, 2026, 12:15 PM UTC
Company data
Company intelligence
Company profile
- Sector
- Healthcare
- Industry
- Medical - Diagnostics & Research
- Chief executive
- Udit Batra
- Employees
- 15,000
- IPO date
- Nov 17, 1995
- Country
- US
- Exchange
- New York Stock Exchange
Rating factors
- Return on equityi
- 2
- Return on assetsi
- 3
- Debt to equityi
- 2
- Price to earningsi
- 1
- Price to booki
- 3
Company press releases
Congressional disclosures
Senate
House
Market cap history
Largest fund holders
| Fund | Weight | Shares held |
|---|---|---|
| VTI | 0.06% | 3.1M |
| VOO | 0.07% | 2.6M |
| VO | 0.43% | 2.1M |
| IVV | 0.07% | 1.3M |
| XAW.TO | 0.04% | 1.3M |
| 1657.T | 0.05% | 1.3M |
| FXAIX | 0.07% | 1.2M |
| SPY | 0.07% | 1.2M |
| VOT | 1.02% | 771.3K |
| VUG | 0.08% | 754.9K |
| XLV | 0.67% | 726.8K |
| VVORX | 2.45% | 539.6K |
Analyst track record
How the analysts covering WAT have done: ratings, price-target accuracy and the measured reaction after their calls.
| 12 months | 3 years | |
|---|---|---|
| Ratings | 106 | 248 |
| Analysts | 30 | 38 |
| Buy / hold / sell | 64 / 42 / 0 | 110 / 129 / 9 |
| Upgrades / downgrades / initiations | 6 / 0 / 10 | 14 / 2 / 15 |
| Price targets hit / missed | 82 / 17 (83%) | 216 / 18 (92%) |
| Avg. return after a rating (TipRanks) | +13.0% | +23.7% |
| Best / worst call | +44.5% / -11.1% | +107.3% / -31.9% |
After buy calls on this stock: median 21-day move +2.2% vs S&P 500 +0.9% (n = 97)
Most accurate on this stock
Share of an analyst's price targets on this stock that the price reached within 12 months (our measurement over the last 3 years, at least 8 targets). It describes past calls, not the odds of the current one.
- Luke SergottBarclays67% hit rate on this stock · 9 targets measuredBuytarget $530Nov 4, 2026
- Tycho PetersonJefferies56% hit rate on this stock · 9 targets measuredBuytarget $470Feb 10, 2026
Latest ratings
| Date | Analyst | Call | Target | |
|---|---|---|---|---|
| Nov 4, 2026 | Avantika DhabariaBank of America SecuritiesNov 4, 2026 | HoldMaintained | –↗ | article ↗ |
| Nov 4, 2026 | David WestenbergPiper SandlerNov 4, 2026 | BuyMaintained | $530↗ | article ↗ |
| Nov 4, 2026 | Daniel BrennanTD CowenNov 4, 2026 | BuyMaintained | $530↗ | article ↗ |
| Nov 4, 2026 | Joanne WuenschCitiNov 4, 2026 | BuyMaintained | $536↗ | article ↗ |
| Nov 4, 2026 | Casey WoodringJ.P. MorganNov 4, 2026 | HoldMaintained | $470↗ | article ↗ |
TipRanks data · computed Nov 10, 2026 · 106 ratings
Frequently asked questions
Where can I trade WAT perpetual futures?
Waters Corporation (WAT) perpetual futures trade on one crypto venue: MEXC. PerpEquities shows its live price, funding rate, open interest and liquidity.
Can I trade WAT around the clock?
Yes. Unlike the underlying stock, WAT perpetuals trade 24/7 — including weekends and outside regular market hours.
What is the funding rate on WAT perpetuals?
Right now the WAT perp funding rate is +21.9% annualized (one venue). A positive rate means longs pay shorts. PerpEquities shows the live rate and its history.
How does the WAT perp price compare to the Waters Corporation stock?
The venue-median WAT perp mark is $470.8 versus a reference stock price of $470.8, a basis of 0.0%. Perps follow the stock through an index price; the gap widens when funding or liquidity diverge between venues.
What is a WAT perpetual future?
A WAT perpetual is a derivative that tracks the price of Waters Corporation with no expiry date. It lets you take long or short exposure to Waters Corporation on crypto venues, around the clock.
What is WATUSDT perpetual?
WATUSDT is the symbol most crypto exchanges use for the Waters Corporation perpetual settled in USDT (Tether). It tracks the WAT share price through an index, trades 24/7 with leverage and never expires.
Embed this asset
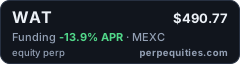
<a href="https://perpequities.com/stocks/wat-perp"><img src="https://perpequities.com/badge/wat-perp.svg" width="240" height="64" alt="WAT perpetuals · perpequities.com" loading="lazy"></a>