
Equity · Technology
Arqit Quantum Inc. (ARQQ) perpetual futures
ARQQ perpetual futures on 1 crypto exchange – live perp price vs the stock, funding rate, open interest and where to trade ARQQUSDT.
Arqit Quantum Inc. provides cybersecurity services through satellite and terrestrial platforms and offers QuantumCloud, a platform-as-a-service that creates unbreakable software encryption keys, along with maintenance, support and professional services.
Price chart
Use the left and right arrow keys to inspect points on the chart.
Trading data
Perpetual market activity
1/2 live markets
Trading data
Perpetual market activity
Spot performance
Venue matrix
2 markets
Some venue links are sponsored. We may receive a commission, and eligible users may occasionally receive trading-fee discounts, at no additional cost to you.
 Bitget
 BingX
Tradability
Execution quality
Entry cost and depth per venue at $1k–$100k
Tradability
Execution quality
Entry cost and depth per venue at $1k–$100kNo sufficient depth · 0 of 1 venues absorb $10k
No fresh book data: Bitget
Taker execution estimate incl. approx. fees - maker fills are not guaranteed.
Best venues for this underlying
Best liquidity
ARQQTightest spread
ARQQHighest volume
ARQQFunding history
Stored venue snapshots by market
Funding history
Stored venue snapshots by marketNext catalyst
Catalysts
Next catalyst
Catalysts
No unusual perp activity right now.
Research data
Analysts, filings and peer context
Research data
Analysts, filings and peer context
Estimates
6Company events
6Peer comparison
Similar listed perpsRevenue mix
Latest annualAnalysts
Price targets in USD| Consensus rating | Buy |
|---|---|
| Average 12-month price target | $60 |
| 12-month target range (low – high) | $60 – $60 |
| Ratings in the provider's consensus | 2 |
Price targets as of 2026-11-21
Analyst rating history
Ratings| Month | Strong buy | Buy | Hold | Sell | Strong sell |
|---|---|---|---|---|---|
| Mar 2026 | 0 | 1 | 0 | 0 | 0 |
| Feb 2026 | 0 | 1 | 0 | 0 | 0 |
| Jan 2026 | 0 | 1 | 0 | 0 | 0 |
| Dec 2025 | 0 | 1 | 0 | 0 | 0 |
| Nov 2025 | 1 | 1 | 0 | 0 | 0 |
| Oct 2025 | 1 | 0 | 0 | 0 | 0 |
| Sep 2025 | 1 | 0 | 0 | 0 | 0 |
| Aug 2025 | 1 | 0 | 0 | 0 | 0 |
| Jul 2025 | 1 | 0 | 0 | 0 | 0 |
| Jun 2025 | 1 | 0 | 0 | 0 | 0 |
| May 2025 | 1 | 0 | 0 | 0 | 0 |
| Apr 2025 | 1 | 0 | 0 | 0 | 0 |
Ownership
Institutional · 2026-Q2Reference market activity
ARQQ-PERPPrice performance
11Insider activity
FY2026 Q4Insider transactions
25Arqit Quantum (ARQQ) director Lefebvre d'Ovidio Manfredi filed a Form 4/A amendment covering one transaction dated 2026-10-01, reporting 0 shares of common stock at $0.00, with 0 shares owned after. The filing code is unspecified and shows no share movement.
Director Lefebvre d'Ovidio Manfredi filed a Form 4/A amendment for Arqit Quantum. It reflects one transaction dated 2026-07-21 reported with 0 shares at $0.00, leaving 0 shares owned.
Arqit Quantum director Lefebvre d'Ovidio Manfredi was awarded 817 Restricted Share Units on Oct 15, 2026, which converted into 817 Ordinary Shares on Oct 16 (M-Exempt). He then owned 53,924 Ordinary Shares.
Director Carlo Calabria received 919 restricted share units as an award and converted them into 919 ordinary shares; he held 234,147 ordinary shares afterward.
Arqit Quantum director Garth Ritchie received an award of 1,021 restricted share units on Oct 15, 2026, and on Oct 16 the same 1,021 RSUs were converted into 1,021 ordinary shares, leaving him 106,855 ordinary shares.
Arqit Quantum (ARQQ) CEO Andrew Leaver sold 2,573 ordinary shares on 2026-10-13 at $16.404 per share, leaving 53,966 shares owned after the sale. The Form 4 was filed 2026-10-15.
Arqit Quantum CEO Andrew Leaver converted 5,209 restricted share units (M-Exempt) into 5,209 ordinary shares on 2026-10-12. After the conversion he owned 56,539 ordinary shares.
Arqit Quantum officer Ben Simon Wilder reported selling 218 ordinary shares at $24.1915 on 2026-10-06, leaving 4,243 shares held.
Arqit Quantum officer Nilan Nicholas William sold 493 Ordinary Shares at $24.1915 on Oct 6, 2026, leaving 1,370 shares held.
Arqit Quantum Inc. (ARQQ) director Ritchie Garth sold 118 Ordinary Shares at $24.1915 on Oct 6, 2026, leaving 105,834 shares owned.
Arqit Quantum officer Willcocks Patrick (General Counsel) sold 555 ordinary shares at $24.1915 on Oct 6, 2026, leaving 11,209 shares owned.
Arqit Quantum officer Paul Feenan (Chief Revenue Officer) sold 504 ordinary shares at $24.1915 on Oct 6, 2026, leaving 20,912 shares owned.
Arqit Quantum CEO Andrew Leaver sold 2,398 ordinary shares at $24.1915 on 2026-10-06, leaving 51,330 shares owned.
Arqit Quantum CEO Andrew Leaver converted 5,208 restricted share units into 5,208 ordinary shares. He sold 2,535 shares at $23.7847 and disposed of 2,818 shares at $24.4743; 2,818 ordinary shares and 5,209 restricted share units were also disposed of via other transactions.
Filings
88 · Latest SEC filingsArqit Quantum (ARQQ) director Lefebvre d'Ovidio Manfredi filed a Form 4/A amendment covering one transaction dated 2026-10-01, reporting 0 shares of common stock at $0.00, with 0 shares owned after. The filing code is unspecified and shows no share movement.
Director Lefebvre d'Ovidio Manfredi filed a Form 4/A amendment for Arqit Quantum. It reflects one transaction dated 2026-07-21 reported with 0 shares at $0.00, leaving 0 shares owned.
Director Carlo Calabria received 919 restricted share units as an award and converted them into 919 ordinary shares; he held 234,147 ordinary shares afterward.
Arqit Quantum director Lefebvre d'Ovidio Manfredi was awarded 817 Restricted Share Units on Oct 15, 2026, which converted into 817 Ordinary Shares on Oct 16 (M-Exempt). He then owned 53,924 Ordinary Shares.
Arqit Quantum director Garth Ritchie received an award of 1,021 restricted share units on Oct 15, 2026, and on Oct 16 the same 1,021 RSUs were converted into 1,021 ordinary shares, leaving him 106,855 ordinary shares.
Arqit Quantum (ARQQ) CEO Andrew Leaver sold 2,573 ordinary shares on 2026-10-13 at $16.404 per share, leaving 53,966 shares owned after the sale. The Form 4 was filed 2026-10-15.
Arqit Quantum CEO Andrew Leaver converted 5,209 restricted share units (M-Exempt) into 5,209 ordinary shares on 2026-10-12. After the conversion he owned 56,539 ordinary shares.
Arqit Quantum officer Willcocks Patrick (General Counsel) sold 555 ordinary shares at $24.1915 on Oct 6, 2026, leaving 11,209 shares owned.
Arqit Quantum officer Paul Feenan (Chief Revenue Officer) sold 504 ordinary shares at $24.1915 on Oct 6, 2026, leaving 20,912 shares owned.
Arqit Quantum officer Nilan Nicholas William sold 493 Ordinary Shares at $24.1915 on Oct 6, 2026, leaving 1,370 shares held.
Arqit Quantum Inc. (ARQQ) director Ritchie Garth sold 118 Ordinary Shares at $24.1915 on Oct 6, 2026, leaving 105,834 shares owned.
Arqit Quantum CEO Andrew Leaver sold 2,398 ordinary shares at $24.1915 on 2026-10-06, leaving 51,330 shares owned.
Arqit Quantum officer Ben Simon Wilder reported selling 218 ordinary shares at $24.1915 on 2026-10-06, leaving 4,243 shares held.
Arqit Quantum officer Nilan Nicholas William exercised 959 restricted share units into 959 ordinary shares and sold 522 ordinary shares at $23.7847, leaving 904 shares.
Director Manfredi Lefebvre d'Ovidio reported an M-Exempt exercise: 1,359 restricted share units were converted into 1,359 Arqit Quantum ordinary shares across 5 transactions at $0.00. No open-market purchases or sales.
Director Garth Ritchie converted 248 restricted share units into 248 Arqit Quantum ordinary shares (M-Exempt) and sold 127 ordinary shares at $23.7847 (S-Sale) on 2026-10-05. He held 105,952 shares after the sale.
Arqit Quantum officer Ben Simon Wilder converted 443 restricted share units into 443 ordinary shares and sold 233 ordinary shares at $23.7847, leaving 4,461 shares held.
Arqit Quantum CEO Andrew Leaver converted 5,208 restricted share units into 5,208 ordinary shares. He sold 2,535 shares at $23.7847 and disposed of 2,818 shares at $24.4743; 2,818 ordinary shares and 5,209 restricted share units were also disposed of via other transactions.
Director Carlo Calabria reported exempt exercises converting 248 restricted share units into 248 ordinary shares of Arqit Quantum, leaving 233,228 ordinary shares owned.
Arqit Quantum officer Paul Feenan converted 1,034 restricted share units into 1,034 ordinary shares and sold 533 ordinary shares at $23.7847.
Arqit Quantum officer Willcocks Patrick (General Counsel) converted 1,148 restricted share units into 1,148 ordinary shares and sold 588 ordinary shares at $23.7847 on 2026-10-05, leaving 11,764 shares held.
Arqit Quantum director Ritchie Garth converted 250 restricted share units into 250 ordinary shares via exempt exercises and sold 121 ordinary shares at $24.4743 on the open market.
Arqit Quantum officer Willcocks Patrick converted 1,148 restricted share units into 1,148 ordinary shares and sold 557 ordinary shares at $24.4743.
Arqit Quantum COO Ben Simon Wilder converted 445 restricted share units into 445 ordinary shares and sold 221 ordinary shares at $24.4743 on 2026-10-02.
Arqit Quantum officer Nilan Nicholas William converted 960 restricted share units into 960 ordinary shares and sold 494 ordinary shares at $24.47.
Arqit Quantum officer Feenan Paul converted 1,034 restricted share units into 1,034 ordinary shares and sold 506 ordinary shares at $24.4743.
Arqit Quantum director Lefebvre d'Ovidio Manfredi reported an M-Exempt exercise converting 1,361 restricted share units into 1,361 ordinary shares across 5 transactions on 2026-10-02.
Director Calabria Carlo reported exercising 250 restricted share units (M-Exempt) on 2026-10-02, converting them into 250 Ordinary Shares of Arqit Quantum Inc.; no open-market purchase or sale occurred. He held 232,980 Ordinary Shares afterward.
Arqit Quantum CEO Andrew Leaver converted 5,208 restricted share units into 5,208 ordinary shares and sold 2,818 ordinary shares at $24.47, leaving 59,082 shares owned.
Arqit Quantum officer Ben Simon Wilder reported exercising 445 restricted share units (2 transactions) into 445 ordinary shares on 2026-10-01. No open-market purchase or sale occurred.
Arqit Quantum director Calabria Carlo reported 4 M-Exempt settlements in which 252 Restricted Share Units converted into 252 Ordinary Shares; 232,730 Ordinary Shares were held after. No open-market purchases or sales took place.
Arqit Quantum director Lefebvre d'Ovidio Manfredi reported the conversion of 1,364 restricted share units into 1,364 ordinary shares on Oct 1, 2026, across five exempt transactions, with no open-market purchase or sale.
Arqit Quantum officer Nilan Nicholas William (GM-US) reported a Form 4: 960 Restricted Share Units were converted/exercised into 960 Ordinary Shares, leaving 960 Ordinary Shares held.
Arqit Quantum officer Patrick Willcocks converted 1,151 restricted share units into 1,151 ordinary shares via 3 exempt option/RSU exercises; no open-market purchase or sale occurred.
Director Garth Ritchie reported the vesting of 252 restricted share units into 252 ordinary shares of Arqit Quantum (4 exempt conversions) on 2026-10-01, leaving 105,702 ordinary shares held.
Arqit Quantum officer Paul Feenan (Chief Revenue Officer) reported converting 1,036 restricted share units into 1,036 ordinary shares via M-Exempt exercises, after which he held 19,907 ordinary shares.
Arqit Quantum CEO Andrew Leaver reported a Form 4: on Oct 1, 2026, 5,209 restricted share units were converted into 5,209 ordinary shares (M-Exempt), leaving 56,692 shares owned.
Arqit Quantum director Lefebvre d'Ovidio Manfredi exercised in-the-money warrants on 2026-09-22: 4,600,000 warrants (right to buy) at $2.50 converted into 4,600,000 Ordinary Shares, leaving 8,942,448 shares owned and 0 warrants.
Director Lefebvre d'Ovidio Manfredi converted 673 restricted share units into 673 ordinary shares of Arqit Quantum on 2026-07-17, leaving 49,023 ordinary shares owned and 0 RSUs remaining.
Director Garth Ritchie converted 841 restricted share units into 841 ordinary shares of Arqit Quantum on 2026-07-17, leaving 105,450 shares owned afterward.
Director Carlo Calabria converted 757 restricted share units into 757 ordinary shares of Arqit Quantum, now holding 232,478 shares.
Director Manfredi Lefebvre d'Ovidio received a grant of 673 Restricted Share Units in Arqit Quantum, bringing his holding to 673 units. This was a compensation award, not an open-market purchase.
Director Carlo Calabria was awarded 757 Restricted Share Units on 2026-07-15, a compensation grant rather than an open-market purchase, bringing his holding to 757 shares.
Arqit Quantum director Garth Ritchie was granted 841 Restricted Share Units on 2026-07-15 as compensation, bringing his holdings to 841 shares.
Director Manfredi Lefebvre d'Ovidio sold 412 Business Combination Warrants in 2 transactions (404 and 8 shares) on 2026-07-09/10 at $0.00, leaving 14,097 warrants owned afterward.
Director Manfredi Lefebvre d'Ovidio sold 150 Business Combination Warrants (right to buy) in 2 transactions on 2026-07-07 and 2026-07-08, leaving 14,509 warrants owned afterward.
Director Manfredi Lefebvre d'Ovidio sold 133 Business Combination Warrants across 2 transactions on Jul 2 and Jul 6, 2026, leaving 14,659 warrants owned afterward.
Director Manfredi Lefebvre d'Ovidio converted 4,133 Restricted Share Units into 4,133 Ordinary Shares of Arqit Quantum on 2026-07-01 (no cash paid).
Director Carlo Calabria reported 799 restricted share units (RSUs) converted into 799 ordinary shares of Arqit Quantum via M-Exempt transactions on 2026-07-01. No open-market purchases or sales. Holdings after: 231,721 ordinary shares.
Arqit Quantum's General Counsel Patrick Willcocks converted 3,555 RSUs into 3,555 ordinary shares, then sold 2,009 ordinary shares at $25.2026 each.
CEO Andrew Leaver converted 15,625 RSUs into 15,625 ordinary shares, then sold 9,893 ordinary shares at $25.2026 each.
Arqit Quantum's Chief Revenue Officer converted 3,222 RSUs into 3,222 ordinary shares, then sold 1,834 ordinary shares at $25.2026 each.
Director Garth converted 799 RSUs into 799 ordinary shares, then sold 439 ordinary shares at $25.2026, retaining 104,609 shares afterward.
Arqit Quantum COO Ben Simon Wilder converted 1,333 RSUs into 1,333 ordinary shares, then sold 769 ordinary shares at $25.20 each.
Director Manfredi Lefebvre d'Ovidio sold 54,444 ordinary shares at $30.07-$30.24 per share and separately sold 195 business combination warrants, across two transactions each.
Patrick Willcocks (General Counsel) sold 4,000 Ordinary Shares of Arqit Quantum at $29.48 on 2026-06-30, leaving 7,916 shares owned afterward.
Director Manfredi Lefebvre d'Ovidio sold 430 Business Combination Warrants across 2 transactions (317 on 6/26, 113 on 6/29), leaving 14,987 warrants owned.
Director Manfredi Lefebvre d'Ovidio sold a total of 1,114 Business Combination Warrants across 2 transactions on 2026-06-24 and 2026-06-25, at a reported price of $0.00 each, leaving 15,416 warrants owned after the last sale.
CRO Jennifer Bers converted 15,000 RSUs into 15,000 ordinary shares, then sold 8,288 shares at $21.42, keeping 6,712 shares.
Director Manfredi Lefebvre d'Ovidio sold 612 Business Combination Warrants over 2 transactions (June 22-23, 2026) at $0.00, leaving 16,530 warrants owned afterward.
CFO Russell Robert Michael received a grant of 5,202 restricted stock units on 2026-04-01, with no acquisition cost.
Chief Revenue Officer Jennifer Bers received 24,821 restricted stock units in two grants (April 1 and April 20, 2026) at no cost.
Director sold 1,404 business combination warrants in two open-market transactions on June 17–18, 2026.
Director Lefebvre d'Ovidio Manfredi sold 784 Business Combination Warrants of Arqit Quantum in 2 transactions on June 15-16, 2026, reducing holdings to 18,546.
Director Lefebvre d'Ovidio Manfredi sold 1,528 Business Combination Warrants over two transactions, reducing his holdings to 19,330.
Director Lefebvre d'Ovidio Manfredi sold 114 Business Combination Warrants in two transactions on 2026-06-09 and 2026-06-10, reducing holdings to 20,858.
Director Lefebvre d'Ovidio Manfredi sold a total of 174 Business Combination Warrants (right to buy) in 2 open-market transactions on June 5 and 8, 2026, reducing his holdings to 20,971 warrants.
Director Carlo Calabria exercised an option to convert 120,000 warrants into 120,000 ordinary shares at $2.50 each on June 3, 2026.
Director Garth converted 73,562 warrant rights into 73,562 ordinary shares on June 5, 2026, leaving no warrants and 104,249 shares held.
Director Lefebvre d'Ovidio Manfredi sold 240 Business Combination Warrants in two transactions, reducing holdings to 21,145.
No reportable transactions; the filing shows zero shares acquired or disposed.
Insider filing on Form 3: director Levis Cristina reported an event involving 0 shares of common stock at $0.00, with no change in beneficial ownership.
Director Lefebvre d'Ovidio Manfredi disposed of 377 Business Combination Warrants (right to buy) in 2 open-market sales, with no proceeds, reducing holdings to 21,624.
Director Lefebvre d'Ovidio Manfredi sold 303 Business Combination Warrants of Arqit Quantum across 2 transactions, reducing holdings to 22,001.
Transcripts
Earnings callsFY2026 Q22026-05-21
Earnings calls
AI summary
positiveArqit grew H1 FY2026 revenue to $623,000 from $67,000 in the prior year period, executing 11 contracts versus 6 previously, with particular gains in telecommunications and government/defense sectors. The company highlighted accelerated quantum threat timelines from Google, Cloudflare, and IonQ forecasting cryptographically relevant quantum computing capability by 2028-2029, creating heightened demand for post-quantum migration solutions. Key wins include first encryption intelligence contract, first encryption intelligence partnership with a European cybersecurity provider, and expanded Sparkle telecom deployment across 20 Equinix data centers.
Key takeaways
- H1 FY2026 revenue grew 9x YoY to $623,000; executed 11 contracts (vs. 6 in prior year), with 3 in telecom and 8 in government/defense/enterprise
- Google (March 25) and Cloudflare (April 7) pulled forward post-quantum cryptography migration deadlines to 2029; IonQ expects RSA 2048 break window 2028-2029
- Signed first encryption intelligence contract (May 18) and first encryption intelligence partnership agreement (May 19) with European cybersecurity provider
- Sparkle Tier 1 Italian telecom operator launched commercial quantum-safe interconnect secured by Arqit across 20 Equinix data centers; defense contractor partner renewed and upsized contract by ~90%
- Cash position strengthened to $35.9 million as of May 20 plus $13.5 million expected from in-the-money warrants expiring September 2026
Financial highlights
- H1 FY2026 revenue: $623,000 vs. $67,000 in H1 FY2025 (930% increase)
- Administrative expenses (operating costs): $33.9 million vs. $20.2 million in H1 FY2025; includes $12.7 million noncash share-based compensation charge
- Operating loss: $33.7 million vs. $20.0 million in H1 FY2025
- Loss before tax from continuing operations: $33.1 million vs. $19.5 million in H1 FY2025; cash and equivalents $35.9 million as of May 20, 2026 with $13.5 million expected warrant proceeds
Guidance
- Company expects additional encryption intelligence contract wins during balance of fiscal year based on pipeline
- Expected renewal and upsizing of largest U.S. defense-related contract noted as imminent
- Expects further progress in government and defense market in second half of fiscal year
- Projects revenue opportunities to come through go-to-market partnerships with telcos and other channels
Q&A themes
- Market urgency around quantum threat has accelerated with major tech firms (Google, Cloudflare) and quantum companies (IonQ) pulling forward timelines for cryptographically relevant quantum computing to 2028-2029 window
- Recognition that post-quantum migration is a multi-year enterprise-wide initiative extending from data centers to edge devices, not simply a software encryption swap
- Encryption Intelligence tool addresses initial pain point of organizational risk assessment and planning for quantum-safe migration journey
Risks
- Company dependency on contract wins in government/defense sectors, which have historically lengthy procurement cycles
- Revenue base remains small ($623K in H1) relative to administrative expenses ($33.9M), creating significant burn rate despite cash runway of 14+ months plus warrant proceeds
- Post-quantum cryptography adoption timing remains uncertain; market adoption may lag behind technical urgency signals from Google, Cloudflare, and IonQ despite policy tailwinds
FY2025 Q42025-12-09
Earnings calls
AI summary
positiveArqit Quantum ended fiscal 2025 with revenue of $530k versus $293k in FY2024, demonstrating material sequential improvement with H2 revenue of $463k. The company acquired Amplify's encryption intelligence platform to provide end-to-end post-quantum migration solutions and signed key contracts with telecom operators Sparkle and RSG Telecom plus additional defense contracts. Management expects fiscal 2026 will build on FY2025 momentum as organizations move from awareness to action on post-quantum cryptography adoption.
Key takeaways
- Signed 12 demonstration and test engagements in first two months of FY2026, well ahead of FY2025 pace, signaling accelerating market migration to post-quantum security
- Acquired Amplify's encryption intelligence and risk advisory platform to offer comprehensive detect-protect-comply solution for customers' post-quantum migration journeys
- Ended FY2025 with $1.2M in executed contracts representing revenue recognizable in FY2026; H2 FY2025 revenue accelerated to $463k versus H1 FY2025 revenue of $67k
- Expanded partnerships with Intel on confidential computing in trusted domains and with Sparkle on quantum-secure network services, including demonstration of encryption embedded in optical transport layer
- Added defense-related contracts including integration into unmanned battlefield assets; increased US operations and personnel to capture larger share of defense market
Financial highlights
- FY2025 revenue: $530k (FY2024: $293k), with SKA platform and Network Secure revenue of $476k and professional services/maintenance of $54k
- Operating loss FY2025: $38.5M (FY2024: $26.9M); loss before tax from continuing operations: $36.5M (FY2024: $37.4M)
- Cash and cash equivalents as of September 30, 2025: $36.9M
- Administrative expenses FY2025: $34.7M (FY2024: $25.4M); headcount: 91 employees (FY2024: 82 employees); target maximum cash spend: $2.5M per month for FY2026
Guidance
- FY2025 represents a trough year from revenue perspective; expect to build upon $1.2M contracted backlog foundation through FY2026
- Plan to maintain OpEx control at $2.5M per month maximum cash spend in FY2026
- Expect additional announcements about offerings and go-to-market strategies targeted to confidential computing and data sovereignty market in FY2026
- Believe defense market will represent large percentage of revenue over time given multiple demonstration and test engagements underway
Q&A themes
- Market catalysts for accelerating demonstrations include quantum computing advances announced by IBM and Google, government/regulatory mandates requiring post-quantum security on risk registers, and growing awareness of harvest-now-decrypt-later threat
- Encryption intelligence product expected to drive near-term revenue with shorter sales cycles than legacy products, with telco operators using tool on ongoing basis not just for initial assessments
- Seeking bolt-on or tuck-in acquisition opportunities around detect-protect-comply and data sovereignty/confidential compute, particularly technology components lacking quantum-safe intellectual property
- Competition emerging from traditional security vendors as market interest grows; company differentiates through 5+ years of experience, 25 patents, symmetric key agreement approach proven with governments/military, and light/flexible solution extending to network edge
Risks
- Revenue remains modest in absolute terms; company characterized FY2025 as trough year requiring significant execution in FY2026 to realize contracted backlog
- Defense market sales cycles slower than other markets; company undertaking multiple demonstration and test engagements indicating extended sales processes
- Increased competition from traditional security vendors entering post-quantum cryptography space; company facing questions about competitive differentiation
FY2025 Q22025-05-22
Earnings calls
AI summary
positiveArqit Quantum closed significant contracts with a tier-one telecom operator (3-year licensing agreement for NetworkSecure) and the U.S. Department of Defense (1-year program of record) near period end, though revenue recognition was modest at $67k due to customer delays and business model transition to SaaS. The company reduced headcount to 72 employees and maintained cost discipline while building sales pipeline through partnerships and Intel collaborations in confidential computing.
Key takeaways
- Signed 3-year contract with tier-one telecom operator for NetworkSecure with B2B2B pay-as-you-grow model; operator already engaged with 3 significant end customers
- Won first U.S. Department of Defense contract embedding symmetric key agreement software into solution for funded program of record, validating NSA compliance
- Announced Intel collaboration integrating Arqit technology into Intel TDX trusted domain enclaves for confidential computing use cases including AI training
- Reduced headcount 42% YoY to 72 employees while maintaining operational focus; 6 customers generating revenue in H1, down from 9 in prior year due to revenue timing
Financial highlights
- H1 FY2025 revenue: $67,000 vs. $119,000 in H1 FY2024
- SKA platform and NetworkSecure revenue: $52,400; Professional services and maintenance: $14,500
- Operating loss: $17.8 million vs. $16.6 million prior year
- Cash and equivalents at March 31, 2025: $24.8 million; monthly cash burn approximately $2.2-$2.4 million
Guidance
- Expect revenue to commence in H2 FY2025 under delayed EMEA multi-year contract with seven-figure total contract value
- Key focus areas for balance of fiscal year: conversion of test and evaluation engagements into licenses, particularly in telecom space; end-to-end test evaluation with data center operator, telecom operator, AI company, and network/server vendors
- Trailing monthly cash burn expected to remain around $2.2-$2.4 million for meaningful time period; no plans for meaningful headcount growth near term
- Expect sales cycles to compress from initial 14-month telecom deal as blueprints and existing customer references enable faster new customer adoption
Q&A themes
- DoD contract is 1-year initial term with successful completion potentially leading to additional wins; telecom contract is 3-year with expected material growth as end customers sign up
- Sales hiring focused on vertical expertise in telecom and defense sectors; new blueprint sales approach enables faster ramp for commercially-oriented hires compared to early discovery-phase salespeople
- Subscription/SaaS model with multi-year contracts creating deferred revenue benefit; pay-as-you-grow consumption model reduces customer friction and enables upselling
- Intel partnership monetization through enabling enterprises to adopt cloud and AI infrastructure while protecting against quantum threats; confidential computing use cases include AI training, regulated data processing, zero trust enforcement
Risks
- Small contract base vulnerable to timing delays; customer delayed EMEA revenue recognition to late March, adversely affecting H1 results
- Revenue decline H1 YoY ($67k vs. $119k) reflects transition from enterprise upfront recognition to channel partner SaaS model and customer delays, though transition reportedly now largely complete
- Timeline and market adoption uncertainty for quantum computing threat remains; CEO noted Q-Day timing 'sooner than most expect' but uncertain, creating near-term execution risk against long-term market thesis
FY2024 Q42024-12-05
Earnings calls
AI summary
positiveArqit's revenue declined due to an intentional transition from high-upfront perpetual licenses to annual recurring revenue (ARR) contracts, though contract volume grew to 13 customers from 7. The company secured a seven-figure multi-year government contract in the Middle East and executed partnerships with telecom operators including Sparkle, while reducing monthly operating costs to $2.15M and headcount to 82 employees.
Key takeaways
- Revenue declined to $293K from $640K due to strategic shift from perpetual to operational licenses with recurring revenue models
- Executed 13 contracts in FY2024 vs. 7 in FY2023; engaged with 8 telecom network operators and demonstrated technology across 19 technical demonstrations
- Secured seven-figure multi-year Middle East government contract (expected to commence revenue in FY2025) and partnership with Sparkle for Quantum-Safe network-as-a-Service
- Reduced monthly operating costs to $2.15M (from prior levels) and headcount to 82 employees; CEO Andy Leaver appointed to focus on sales execution and market opportunities
- IDC named Arqit a 2024 innovator for post-quantum cryptography; AWS and Gartner highlighted quantum computing and encryption as major 2025 technology trends
Financial highlights
- FY2024 revenue: $293K ($102K professional services; 13 customers with mostly limited demonstration/integration licenses)
- Administrative expenses: $23.5M vs. $55.2M in FY2023; operating loss: $24.6M vs. $54.5M in FY2023
- Cash and equivalents: $18.7M at fiscal year-end vs. $44.5M prior year; $1.8M capital raise completed early October (outside FY2024)
- Headcount: 82 at fiscal year-end vs. 147 in FY2023; share-based compensation charge: negative $1.6M vs. $14.1M in FY2023
Guidance
- Seven-figure Middle East government contract revenue expected to commence in FY2025 on a steady (ratable) basis
- Current cost base expected to deliver all FY2025 expected revenue with very little operating leverage required
- Focus on conversion of existing customer engagements (11 entities in significant technical discussions) rather than expanding sales funnel
Q&A themes
- Middle East government contract to generate steady recurring revenue throughout FY2025; potential for follow-on opportunities with other regional governmental and enterprise customers
- AI integration being explored for remediation workflows to guide customers through vulnerability assessment and quantum-safe implementation in conversational manner
- Financial services, IP-rich organizations, and secure compute verticals emerging as additional target markets beyond government, defense, and telecom infrastructure
Risks
- Revenue transition from perpetual to recurring licenses may delay short-term revenue recognition despite increased contract volume and customer count
- Large enterprise and government customers require extended technical discussions and integration periods; conversion timelines uncertain despite reported positive feedback
- Cash balance declined from $44.5M to $18.7M; company's continued cash burn dependent on near-term contract conversions and revenue ramp
FY2024 Q22024-05-20
Earnings calls
Company news
Reuters, WSJ, Bloomberg and FT first, as far as our news provider delivers them; other publishers behind the second filter. Headlines link to the publisher.No articles from Reuters, WSJ, Bloomberg or FT for this company in our feed.
Company data
Company intelligence
Updated: Nov 22, 2026, 08:45 AM UTC
Company data
Company intelligence
Company profile
- Sector
- Technology
- Industry
- Software - Application
- Chief executive
- Andrew James Leaver
- Employees
- 91
- IPO date
- Apr 1, 2021
- Country
- GB
- Exchange
- NASDAQ Capital Market
Rating factors
- Return on equityi
- 1/5
- Return on assetsi
- 1/5
- Debt to equityi
- 4/5
- Price to earningsi
- 1/5
- Price to booki
- 1/5
Company press releases
Market cap history
Largest fund holders
| Fund | Weight | Shares held |
|---|---|---|
| QTUM | 1.94% | 5M |
| SILX | 0.03% | 292.2K |
| VALT | 0.02% | 287.3K |
| BUG | 0.29% | 224.3K |
| WQTM FP | 2.7% | 154.8K |
| WQTM LN | 3.59% | 68.1K |
| QNTG.L | 0.13% | 54.7K |
| QWTM LN | 0.54% | 47.6K |
| CQTM | 4.71% | 33.2K |
| GARY | 0.23% | 31.5K |
| FNCMX | 0% | 8K |
| QQQS | 0.64% | 6.8K |
Analyst track record
How the analysts covering ARQQ have done: ratings, price-target accuracy and the measured reaction after their calls.
| 12 months | 3 years | |
|---|---|---|
| Ratings | 1 | 11 |
| Analysts | 1 | 1 |
| Buy / hold / sell | 1 / 0 / 0 | 11 / 0 / 0 |
| Upgrades / downgrades / initiations | 0 / 0 / 0 | 0 / 0 / 0 |
| Price targets hit / missed | 0 / 1 (0%) | 4 / 7 (36%) |
| Avg. return after a rating (TipRanks) | -79.0% | +130.1% |
| Best / worst call | -79.0% / -79.0% | +530.5% / -79.0% |
After buy calls on this stock: not enough measured cases yet
Most accurate on this stock
Share of an analyst's price targets on this stock that the price reached within 12 months (our measurement over the last 3 years, at least 8 targets). It describes past calls, not the odds of the current one.
- Scott BuckH.C. Wainwright89% hit rate on this stock · 9 targets measuredBuytarget $60.00Dec 18, 2025
Latest ratings
| Date | Analyst | Call | Target | |
|---|---|---|---|---|
| Dec 18, 2025 | Scott BuckH.C. WainwrightDec 18, 2025 | BuyReiterated | $60.00↗ | article ↗ |
| Oct 13, 2025 | Scott BuckH.C. WainwrightOct 13, 2025 | BuyMaintained | $60.00↗ | article ↗ |
| Sep 18, 2025 | Scott BuckH.C. WainwrightSep 18, 2025 | BuyReiterated | $52.00↗ | article ↗ |
| May 23, 2025 | Scott BuckH.C. WainwrightMay 23, 2025 | BuyReiterated | $52.00↗ | article ↗ |
| Dec 31, 2024 | Scott BuckH.C. WainwrightDec 31, 2024 | BuyMaintained | $52.00↗ | article ↗ |
Share of analysts per call each month (latest call per analyst within 180 days). Targets and closes in USD.
TipRanks data · computed Nov 20, 2026 · 1 ratings
Frequently asked questions
Where can I trade ARQQ perpetual futures?
Arqit Quantum Inc. (ARQQ) perpetual futures trade on one crypto venue: Bitget. PerpEquities shows its live price, funding rate, open interest and liquidity.
Can I trade ARQQ around the clock?
Yes. Unlike the underlying stock, ARQQ perpetuals trade 24/7 — including weekends and outside regular market hours.
What is the funding rate on ARQQ perpetuals?
Right now the ARQQ perp funding rate is 0.0% annualized (one venue). A positive rate means longs pay shorts. PerpEquities shows the live rate and its history.
How does the ARQQ perp price compare to the Arqit Quantum Inc. stock?
The venue-median ARQQ perp mark is $11.1 versus a reference stock price of $11.1, a basis of 0.0%. Perps follow the stock through an index price; the gap widens when funding or liquidity diverge between venues.
What is a ARQQ perpetual future?
A ARQQ perpetual is a derivative that tracks the price of Arqit Quantum Inc. with no expiry date. It lets you take long or short exposure to Arqit Quantum Inc. on crypto venues, around the clock.
What is ARQQUSDT perpetual?
ARQQUSDT is the symbol most crypto exchanges use for the Arqit Quantum Inc. perpetual settled in USDT (Tether). It tracks the ARQQ share price through an index, trades 24/7 with leverage and never expires.
Embed this asset
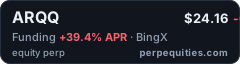
<a href="https://perpequities.com/stocks/arqq-perp"><img src="https://perpequities.com/badge/arqq-perp.svg" width="240" height="64" alt="ARQQ perpetuals · perpequities.com" loading="lazy"></a>