
Equity · Industrials
TransDigm Group Incorporated (TDG) perpetual futures
TDG perpetual futures on 1 crypto exchanges – live perp price vs the stock, funding rate, open interest and where to trade TDGUSDT.
TransDigm Group Incorporated manufactures and distributes aircraft components such as actuators, ignition systems, pumps, valves, sensors and airframe and cabin parts for aerospace and industrial customers.
Price chart
Use the left and right arrow keys to inspect points on the chart.
Trading data
Perpetual market activity
1/1 live markets
Trading data
Perpetual market activity
Spot performance
 MEXC
Tradability
Execution quality
Entry cost and depth per venue at $1k–$100k
Tradability
Execution quality
Entry cost and depth per venue at $1k–$100kThin liquidity · 1 of 1 venues absorb $10k · Typical cost: +51.6 bps
Cheapest execution: MEXC · +51.6 bps
Taker execution estimate incl. approx. fees - maker fills are not guaranteed.
Best venues for this underlying
Best liquidity
TDGTightest spread
TDGHighest volume
TDGFunding history
Stored venue snapshots by market
Funding history
Stored venue snapshots by marketNext catalyst
Catalysts
Next catalyst
Catalysts
No unusual perp activity right now.
Research data
Analysts, filings and peer context
Research data
Analysts, filings and peer context
Estimates
6Company events
6Peer comparison
Similar listed perpsRevenue mix
Latest annualAnalysts
Price targetsAnalyst rating history
RatingsOwnership
Institutional · 2026-Q3Reference market activity
TDG-PERPPrice performance
11Insider activity
FY2026 Q4Insider transactions
25CEO Michael Lisman received 59,287 stock options via A-Award grants on 2026-11-03 at $1,208.04 each, across 5 transactions. This is compensation, not a purchase.
TransDigm CFO Sarah Wynne received an award of 15,150 stock options at $1,208.04 per share on Nov 3, 2026, a compensation grant rather than an open-market purchase, leaving her with 15,150 options owned.
TransDigm officer Joel Reiss was awarded 19,250 stock options at $1,208.04 on Nov 3, 2026, under code A (a grant, not a purchase), leaving him with 19,250 options.
TransDigm officer Patrick Joseph Murphy received a 25,650-share stock option award on 2026-11-03 at a $1,208.04 exercise price, leaving him with 25,650 shares owned after the grant.
Armani Vadiee (officer) was granted 13,600 stock options at an exercise price of $1,208.04 on Nov 3, 2026, per a Form 4 filed Nov 5; this is an award of compensation, not a purchase.
TransDigm director Michele Santana was granted 589 stock options at $1208.04 per share on Nov 3, 2026, an award under transaction code A, not an open-market purchase.
TDG director Peter Palmer received an award of 589 stock options at $1,208.04 per share on Nov 3, 2026, per a Form 4 filed Nov 5, 2026.
Director Robert J. Small received an award of 589 stock options at $1,208.04 per share on Nov 3, 2026, leaving him with 589 owned. This is compensation, not an open-market purchase.
TransDigm director Irina Igorevna Krasik was granted 589 stock options at $1,208.04 per share on Nov 3, 2026, an award rather than a purchase, leaving her with 589 owned after the transaction.
Director Sean P. Hennessy received a grant of 589 stock options (A-Award) at $1208.04 on Nov 3, 2026, bringing his holdings to 589.
TransDigm director Graff Michael received an award of 589 stock options at $1,208.04 per option on Nov 3, 2026, disclosed on Form 4 filed Nov 5, 2026.
TransDigm director Gary E. McCullough received an award of 589 stock options at $1,208.04 per share on 2026-11-03, leaving him with 589 options owned.
Director Howley W Nicholas received a grant of 589 stock options at $1,208.04 per share on Nov 3, 2026, holding 589 after.
TransDigm director Jane M. Cronin was awarded 589 stock options at $1,208.04 per share on Nov 3, 2026, under an A-Award grant, leaving her with 589 options owned.
Director David Barr received a grant of 589 stock options at $1,208.04 each on Nov 3, 2026, an award rather than an open-market purchase, leaving him with 589 owned.
TransDigm officer Joel Reiss exercised options on 4,100 common shares at $284.97 and sold 330 shares on the open market at $1,112.27–$1,117.11. He held 7,370 shares afterward.
Filings
PendingTranscripts
Earnings callsFY2026 Q42026-11-10
Earnings calls
AI summary
positiveTransDigm reported FY2026 fourth quarter results, stating revenue and EBITDA As Defined for the year exceeded its most recent guidance, with all three major end markets delivering double-digit growth for both the quarter and the full year. Q4 EBITDA As Defined margin was 53%, the highest of the year, including roughly 2 percentage points of dilution from recent acquisitions. For FY2027, guidance includes the recently closed Prince & Izant acquisition and assumes no additional acquisitions or divestitures; the revenue midpoint is $12.05 billion, up approximately 14%, with EBITDA As Defined midpoint of $6.27 billion (up ~13%) at a margin of around 52%, including about 2 percentage points of acquisition dilution. Adjusted EPS midpoint is $47.51. The company deployed over $7 billion in FY2026 across M&A and share repurchases, including $2.75 billion of buybacks, and said it has M&A capacity in excess of $10 billion.
Key takeaways
- All three major end markets delivered double-digit growth for both Q4 and the full fiscal year, and full-year revenue and EBITDA As Defined exceeded the most recent guidance.
- Commercial aftermarket revenue rose approximately 17% in Q4 and 14% for the full year; management said elevated oil prices and Middle East tension affecting RPKs have not yet meaningfully impacted aftermarket orders.
- Defense revenue grew approximately 12% in Q4 and 10% for the full year, the third consecutive quarter of double-digit growth, with full-year bookings significantly surpassing the prior year.
- FY2026 capital deployment exceeded $7 billion: approximately $4.4 billion of M&A (including Simmonds, Jet Parts Engineering, Victor Sierra and Prince & Izant) plus nearly $440 million on 12 bolt-on acquisitions, and $2.75 billion of share repurchases.
- Management said it does not expect pending right-to-repair legislation to have a material impact, citing self-funded IP, low price per unit with parts typically replaced rather than repaired, and direct U.S. government sales historically about 6% of total sales with less than 1% potentially subject to repair.
Financial highlights
- Q4 EBITDA As Defined margin was 53%, the highest of the year, including roughly 2 percentage points of dilution from recent acquisitions.
- Q4 organic growth was approximately 14%; commercial OEM revenue rose about 15% for both Q4 and the full year, with commercial transport OEM up 25%.
- FY2026 free cash flow (EBITDA less cash interest, CapEx and cash taxes) was approximately $2.8 billion, ahead of guidance of approximately $2.6 billion.
- The company ended the year with $2.3 billion of cash and net debt-to-EBITDA of 5.9x; FY2026 buybacks totaled $2.75 billion (about 2.3 million shares at an average of $1,187).
Guidance
- FY2027 revenue guidance midpoint is $12.05 billion, up approximately 14%; assumptions are high single-digit to low double-digit commercial OEM growth, high single-digit commercial aftermarket growth and high single-digit defense growth.
- FY2027 EBITDA As Defined guidance midpoint is $6.27 billion, up approximately 13%, with expected margin of around 52%, including approximately 2 full percentage points of dilution from recent acquisitions.
- FY2027 adjusted EPS midpoint is expected to be $47.51; net interest expense about $2.255 billion at a weighted average rate of approximately 6.5%; tax rates of 22% to 24%; weighted average shares of 56.7 million.
- FY2027 free cash flow is estimated at around $2.9 billion, with CapEx of about $380 million and net debt-to-EBITDA expected to delever by at least a turn to below 5x, assuming no further acquisitions, divestitures, share purchases or dividends.
Q&A themes
- M&A approach and pipeline: continued focus on aerospace and defense, gradual broadening into PMA and test and measurement, competition always present but the company believes it can pay the most and still earn attractive IRRs.
- Commercial aftermarket growth versus market: management believes guidance reflects at least in-line growth, based on a detailed bottoms-up build by operating units rather than headline RPKs.
- Capital deployment: buybacks versus dividends, with the $2.75 billion of FY2026 repurchases framed as evidence of perceived value at roughly 20% IRR or better.
- Margin walk: base-business improvement of 1% to 1.5% annually is masked at the consolidated level by acquisition dilution; management also flagged PCB/electronic component lead times and rare earth metals as supply chain watch items.
Risks
- Elevated oil prices and Middle East tension are weighing on RPKs; management views this as a short-term air pocket but is monitoring it closely with customers.
- Recent acquisitions dilute margins by roughly 2 percentage points in both FY2026 and the FY2027 guide, with improvement expected over time.
- Pending right-to-repair legislation could affect government access to technical data; final language and implementing regulations are unknown, though management does not expect a material impact.
Company news
Reuters, WSJ, Bloomberg and FT first, as far as our news provider delivers them; other publishers behind the second filter. Headlines link to the publisher.No articles from Reuters, WSJ, Bloomberg or FT for this company in our feed.
Company data
Company intelligence
Updated: Nov 11, 2026, 11:26 AM UTC
Company data
Company intelligence
Company profile
- Sector
- Industrials
- Industry
- Aerospace & Defense
- Chief executive
- Michael J. Lisman
- Employees
- 16,500
- IPO date
- Mar 15, 2006
- Country
- US
- Exchange
- New York Stock Exchange
Rating factors
- Return on equityi
- 1
- Return on assetsi
- 5
- Debt to equityi
- 1
- Price to earningsi
- 2
- Price to booki
- 1
Company press releases
Congressional disclosures
Senate
House
Market cap history
Largest fund holders
| Fund | Weight | Shares held |
|---|---|---|
| VTI | 0.08% | 1.8M |
| VOO | 0.09% | 1.5M |
| VO | 0.59% | 1.2M |
| IVV.AX | 0.1% | 743.1K |
| SPY | 0.1% | 674.4K |
| VUG | 0.18% | 657.3K |
| FXAIX | 0.09% | 638.1K |
| ITA | 4.95% | 494.8K |
| VOT | 1.41% | 434K |
| CGGR | 1.96% | 415.5K |
| FMAGX | 1.25% | 373.1K |
| XLI | 1.26% | 318.3K |
Analyst track record
How the analysts covering TDG have done: ratings, price-target accuracy and the measured reaction after their calls.
| 12 months | 3 years | |
|---|---|---|
| Ratings | 89 | 287 |
| Analysts | 20 | 27 |
| Buy / hold / sell | 55 / 34 / 0 | 193 / 94 / 0 |
| Upgrades / downgrades / initiations | 0 / 6 / 3 | 3 / 10 / 9 |
| Price targets hit / missed | 3 / 75 (4%) | 23 / 245 (9%) |
| Avg. return after a rating (TipRanks) | -19.0% | -15.6% |
| Best / worst call | +2.1% / -37.9% | +22.6% / -37.9% |
After buy calls on this stock: not enough measured cases yet
Latest ratings
| Date | Analyst | Call | Target | |
|---|---|---|---|---|
| Oct 16, 2026 | Kristine LiwagMorgan Stanley | HoldMaintained | $1,300 | article ↗ |
| Oct 15, 2026 | Kenneth HerbertRBC Capital | HoldMaintained | $1,200 | article ↗ |
| Oct 11, 2026 | Noah PoponakGoldman Sachs | BuyReiterated | $1,745 | article ↗ |
| Oct 9, 2026 | Gautam KhannaTD Cowen | BuyMaintained | $1,300 | article ↗ |
| Oct 7, 2026 | Charles MinervinoSusquehanna | HoldMaintained | $1,350 | article ↗ |
TipRanks data · computed Nov 11, 2026 · 89 ratings
Frequently asked questions
Where can I trade TDG perpetual futures?
TransDigm Group Incorporated (TDG) perpetual futures trade on 1 crypto venues, including MEXC. PerpEquities compares them by live price, funding rate, open interest and liquidity.
Can I trade TDG around the clock?
Yes. Unlike the underlying stock, TDG perpetuals trade 24/7 — including weekends and outside regular market hours.
What is the funding rate on TDG perpetuals?
Right now the TDG perp funding rate is +21.9% annualized (venue median), ranging from +21.9% to +21.9% across 1 venues. A positive rate means longs pay shorts. PerpEquities shows the live rate and its history for every venue.
How does the TDG perp price compare to the TransDigm Group Incorporated stock?
The venue-median TDG perp mark is $1.2K versus a reference stock price of $1.2K, a basis of 0.0%. Perps follow the stock through an index price; the gap widens when funding or liquidity diverge between venues.
What is a TDG perpetual future?
A TDG perpetual is a derivative that tracks the price of TransDigm Group Incorporated with no expiry date. It lets you take long or short exposure to TransDigm Group Incorporated on crypto venues, around the clock.
What is TDGUSDT perpetual?
TDGUSDT is the symbol most crypto exchanges use for the TransDigm Group Incorporated perpetual settled in USDT (Tether). It tracks the TDG share price through an index, trades 24/7 with leverage and never expires.
Embed this asset
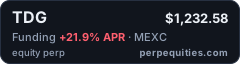
<a href="https://perpequities.com/stocks/tdg-perp"><img src="https://perpequities.com/badge/tdg-perp.svg" width="240" height="64" alt="TDG perpetuals · perpequities.com" loading="lazy"></a>