
Equity · Healthcare
SELLAS Life Sciences Group, Inc. (SLS) perpetual futures
SLS perpetual futures on 1 crypto exchange – live perp price vs the stock, funding rate, open interest and where to trade SLSUSDT.
SELLAS Life Sciences Group is a late-stage clinical biopharmaceutical company developing novel cancer therapeutics, led by the peptide immunotherapy galinpepimut-S (GPS) and the CDK9 inhibitor SLS009 (tambiciclib).
Price chart
Use the left and right arrow keys to inspect points on the chart.
Trading data
Perpetual market activity
1/1 live markets
Trading data
Perpetual market activity
Spot performance
 MEXC
Tradability
Execution quality
Entry cost and depth per venue at $1k–$100k
Tradability
Execution quality
Entry cost and depth per venue at $1k–$100kNo sufficient depth · 0 of 1 venues absorb $10k
No fresh book data: MEXC
Taker execution estimate incl. approx. fees - maker fills are not guaranteed.
Best venues for this underlying
Best liquidity
SLSTightest spread
SLSHighest volume
SLSFunding history
Stored venue snapshots by market
Funding history
Stored venue snapshots by marketNext catalyst
Catalysts
Next catalyst
Catalysts
No unusual perp activity right now.
Research data
Analysts, filings and peer context
Research data
Analysts, filings and peer context
Estimates
6Company events
6Peer comparison
Similar listed perpsAnalysts
Price targets in USD| Consensus rating | Buy |
|---|---|
| Average 12-month price target | $35 |
| 12-month target range (low – high) | $35 – $35 |
| Ratings in the provider's consensus | 5 |
Price targets as of 2026-11-22
Analyst rating history
Ratings| Month | Strong buy | Buy | Hold | Sell | Strong sell |
|---|---|---|---|---|---|
| Nov 2026 | 1 | 1 | 0 | 0 | 0 |
| Oct 2026 | 1 | 1 | 0 | 0 | 0 |
| Sep 2026 | 1 | 1 | 0 | 0 | 0 |
| Aug 2026 | 1 | 1 | 0 | 0 | 0 |
| Jul 2026 | 1 | 1 | 0 | 0 | 0 |
| Jun 2026 | 1 | 1 | 0 | 0 | 0 |
| May 2026 | 1 | 2 | 0 | 0 | 0 |
| Apr 2026 | 1 | 2 | 0 | 0 | 0 |
| Mar 2026 | 1 | 2 | 0 | 0 | 0 |
| Feb 2026 | 1 | 2 | 0 | 0 | 0 |
| Jan 2026 | 1 | 2 | 0 | 0 | 0 |
| Dec 2025 | 1 | 2 | 0 | 0 | 0 |
Ownership
Institutional · 2026-Q3Reference market activity
SLS-PERPPrice performance
11Insider activity
FY2026 Q4Insider transactions
25CFO John Thomas Burns sold 3,831 common shares of SELLAS Life Sciences at $19.178 on Nov 18, 2026, leaving 558,893 shares owned.
Officer Dragan Cicic sold 6,933 shares of SELLAS Life Sciences common stock on Nov 18, 2026, at $19.178 per share (Form 4).
CEO Angelos M. Stergiou sold 26,606 common shares at $19.178 on Nov 18, 2026, leaving 1,734,896 shares held.
CEO Angelos M. Stergiou received a grant of 1,065,000 common shares of SELLAS Life Sciences at $0.00 per share on June 16, 2026, leaving him with 1,759,183 shares owned.
Director John Varian received a 50,000-share award of SELLAS common stock on Jan 7, 2026, at $0.00 per share under an A-Award grant, lifting his holdings to 72,900 shares.
Director Robert L Van Nostrand received a 50,000-share Common Stock award (A) on Jan 7, 2026, at $0.00, leaving 82,900 shares owned. It is a grant, not a purchase.
Director David A. Scheinberg received a grant (A-Award) of 50,000 common shares of SELLAS Life Sciences on 2026-01-07 at $0.00, leaving 73,082 shares owned.
SELLAS officer Dragam Cicic was awarded 300,000 common shares on Jan 7, 2026, bringing his holding to 557,805 shares.
SELLAS CFO John Thomas Burns received a 300,000-share Common Stock award on Jan 7, 2026, a grant at $0.00, leaving him with 554,327 shares owned.
Director Kalin Katherine Bach received a 50,000-share Common Stock grant (A-Award, $0.00) on 2026-01-07, raising her holdings to 154,400 shares.
Director Jane Wasman received an award of 50,000 shares of SELLAS Life Sciences common stock on 2026-01-07, a grant rather than a purchase, bringing her holdings to 92,900 shares after the transaction.
SLS officer CICIC DRAGAN reported disposing of 63,800 common shares at $1.50 under code J-Other on 2025-12-03, leaving 257,805 shares owned.
CFO John Thomas Burns disposed of 58,592 shares of SELLAS common stock at $1.50 per share under code J-Other, leaving 254,327 shares owned after the 2025-12-03 transaction.
CEO Angelos M. Stergiou reported a J-Other disposition of 187,066 common shares at $1.50 on 2025-12-03, leaving 686,966 shares owned.
Director Kalin Katherine Bach bought 63,400 shares of SELLAS Life Sciences common stock at $1.59 each in an open-market purchase, ending with 104,400 shares owned.
Director Robert L. Van Nostrand bought 10,000 shares of SELLAS Life Sciences common stock at $1.48 per share, bringing his holdings to 20,400 shares.
Director Jane Wasman reported an open-market purchase of 20,000 SELLAS Life Sciences common shares at $1.69, raising her holdings to 30,400 shares.
SELLAS director Kalin Katherine Bach bought 20,000 common shares at $1.80 in an open-market purchase on May 22, 2025, bringing her holdings to 41,000 shares.
CFO John Thomas Burns received 194,300 common shares and 169,500 stock options (strike $0.9525) as compensation grants on Jan 10, 2025, per Form 4 filed Jan 14, 2025.
CEO Angelos M. Stergiou received grants of 500,900 common shares and options for 385,750 shares at $0.9525, per a Form 4 filed Jan 14, 2025.
Director David A. Scheinberg received a grant (A-Award) of 12,500 shares of Common Stock at $0.00 on 2025-01-10, bringing his holdings to 23,082 shares. This is compensation, not an open-market purchase.
Filings
35 · Latest SEC filingsCFO John Thomas Burns sold 3,831 common shares of SELLAS Life Sciences at $19.178 on Nov 18, 2026, leaving 558,893 shares owned.
Officer Dragan Cicic sold 6,933 shares of SELLAS Life Sciences common stock on Nov 18, 2026, at $19.178 per share (Form 4).
CEO Angelos M. Stergiou sold 26,606 common shares at $19.178 on Nov 18, 2026, leaving 1,734,896 shares held.
CEO Angelos M. Stergiou received a grant of 1,065,000 common shares of SELLAS Life Sciences at $0.00 per share on June 16, 2026, leaving him with 1,759,183 shares owned.
Director John Varian received a 50,000-share award of SELLAS common stock on Jan 7, 2026, at $0.00 per share under an A-Award grant, lifting his holdings to 72,900 shares.
Transcripts
PendingCompany news
Reuters, WSJ, Bloomberg and FT first, as far as our news provider delivers them; other publishers behind the second filter. Headlines link to the publisher.No articles from Reuters, WSJ, Bloomberg or FT for this company in our feed.
Company data
Company intelligence
Updated: Nov 22, 2026, 11:57 AM UTC
Company data
Company intelligence
Company profile
- Sector
- Healthcare
- Industry
- Biotechnology
- Chief executive
- Angelos Stergiou
- Employees
- 13
- IPO date
- Mar 12, 2008
- Country
- US
- Exchange
- NASDAQ
Rating factors
- Return on equityi
- 1/5
- Return on assetsi
- 1/5
- Debt to equityi
- 4/5
- Price to earningsi
- 1/5
- Price to booki
- 1/5
Company press releases
Market cap history
Largest fund holders
| Fund | Weight | Shares held |
|---|---|---|
| XBI | 0.44% | 5.8M |
| IWM | 0.05% | 5.2M |
| VTS.AX | 0% | 5.1M |
| NJM | 0.04% | 4M |
| VXF | 0.02% | 2.3M |
| IWO | 0.1% | 1.9M |
| NLO | 0.08% | 1.4M |
| FSSNX | 0.08% | 1.4M |
| VTWO | 0.06% | 1.2M |
| SCHA | 0.04% | 1.1M |
| IWC | 0.39% | 615.2K |
| VHT | 0.02% | 603.2K |
Analyst track record
How the analysts covering SLS have done: ratings, price-target accuracy and the measured reaction after their calls.
| 12 months | 3 years | |
|---|---|---|
| Ratings | 11 | 36 |
| Analysts | 3 | 4 |
| Buy / hold / sell | 11 / 0 / 0 | 36 / 0 / 0 |
| Upgrades / downgrades / initiations | 0 / 0 / 0 | 0 / 0 / 0 |
| Price targets hit / missed | 7 / 4 (64%) | 32 / 4 (89%) |
| Avg. return after a rating (TipRanks) | +59.2% | +241.5% |
| Best / worst call | +173.6% / -52.1% | +378.8% / -52.1% |
After buy calls on this stock: median 21-day move +7.5% vs S&P 500 +4.8% (n = 35)
Most accurate on this stock
Share of an analyst's price targets on this stock that the price reached within 12 months (our measurement over the last 3 years, at least 8 targets). It describes past calls, not the odds of the current one.
- Jason McCarthyMaxim Group50% hit rate on this stock · 22 targets measuredBuytarget $40.00Nov 17, 2026
Latest ratings
| Date | Analyst | Call | Target | |
|---|---|---|---|---|
| Nov 17, 2026 | Jason McCarthyMaxim GroupNov 17, 2026 | BuyMaintained | $40.00↗ | article ↗ |
| Nov 13, 2026 | Jason McCarthyMaxim GroupNov 13, 2026 | BuyMaintained | $30.00↗ | article ↗ |
| Jul 6, 2026 | James MolloyAlliance Global PartnersJul 6, 2026 | BuyReiterated | $25.00↗ | article ↗ |
| Jul 6, 2026 | Matthew VeneziaAlliance Global PartnersJul 6, 2026 | BuyReiterated | $25.00↗ | article ↗ |
| May 14, 2026 | Jason McCarthyMaxim GroupMay 14, 2026 | BuyReiterated | $10.00↗ | article ↗ |
Share of analysts per call each month (latest call per analyst within 180 days). Targets and closes in USD.
TipRanks data · computed Nov 18, 2026 · 11 ratings
Frequently asked questions
Where can I trade SLS perpetual futures?
SELLAS Life Sciences Group, Inc. (SLS) perpetual futures trade on one crypto venue: MEXC. PerpEquities shows its live price, funding rate, open interest and liquidity.
Can I trade SLS around the clock?
Yes. Unlike the underlying stock, SLS perpetuals trade 24/7 — including weekends and outside regular market hours.
What is the funding rate on SLS perpetuals?
Right now the SLS perp funding rate is +14.1% annualized (one venue). A positive rate means longs pay shorts. PerpEquities shows the live rate and its history.
How does the SLS perp price compare to the SELLAS Life Sciences Group, Inc. stock?
The venue-median SLS perp mark is $14.7 versus a reference stock price of $14.7, a basis of 0.0%. Perps follow the stock through an index price; the gap widens when funding or liquidity diverge between venues.
What is a SLS perpetual future?
A SLS perpetual is a derivative that tracks the price of SELLAS Life Sciences Group, Inc. with no expiry date. It lets you take long or short exposure to SELLAS Life Sciences Group, Inc. on crypto venues, around the clock.
What is SLSUSDT perpetual?
SLSUSDT is the symbol most crypto exchanges use for the SELLAS Life Sciences Group, Inc. perpetual settled in USDT (Tether). It tracks the SLS share price through an index, trades 24/7 with leverage and never expires.
Embed this asset
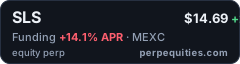
<a href="https://perpequities.com/stocks/sls-perp"><img src="https://perpequities.com/badge/sls-perp.svg" width="240" height="64" alt="SLS perpetuals · perpequities.com" loading="lazy"></a>