 Bitget
 BingX
Reference market
Closed- Regular hours
- CLOSED – CLOSED EST
- Next holiday
- Nov 26, 2026 · Thanksgiving Day
 PerpEquities
Equity · Industrials
PL perpetual futures on 1 crypto exchange – live perp price vs the stock, funding rate, open interest and where to trade PLUSDT.
Planet Labs PBC builds and manages satellite constellations and sells frequent global geospatial data through a cloud-native online platform, serving agriculture, cartography, forestry, finance, insurance and government customers.
Use the left and right arrow keys to inspect points on the chart.
Trading data
Some venue links are sponsored. We may receive a commission, and eligible users may occasionally receive trading-fee discounts, at no additional cost to you.
Tradability
Thin liquidity · 1 of 1 venues absorb $10k · Typical cost: +32.2 bps
Cheapest execution: Bitget · +32.2 bps
Taker execution estimate incl. approx. fees - maker fills are not guaranteed.
Next catalyst
No unusual perp activity right now.
Reference data
Research data
| Consensus rating | Buy |
|---|---|
| Average 12-month price target | $28.63 |
| 12-month target range (low – high) | $17 – $40 |
| Ratings in the provider's consensus | 23 |
Price targets as of 2026-11-21
| Month | Strong buy | Buy | Hold | Sell | Strong sell |
|---|---|---|---|---|---|
| Nov 2026 | 1 | 7 | 5 | 0 | 0 |
| Oct 2026 | 1 | 6 | 5 | 0 | 0 |
| Sep 2026 | 1 | 7 | 4 | 1 | 0 |
| Aug 2026 | 1 | 6 | 3 | 1 | 0 |
| Jul 2026 | 1 | 6 | 3 | 1 | 0 |
| Jun 2026 | 1 | 6 | 3 | 1 | 0 |
| May 2026 | 1 | 6 | 3 | 1 | 0 |
| Apr 2026 | 1 | 6 | 3 | 0 | 0 |
| Mar 2026 | 1 | 6 | 3 | 0 | 0 |
| Feb 2026 | 1 | 6 | 3 | 0 | 0 |
| Jan 2026 | 1 | 6 | 3 | 0 | 0 |
| Dec 2025 | 1 | 6 | 3 | 0 | 0 |
Planet Labs director and Co-Founder/Chief Strategy Officer Robert H. Schingler reported gifting 55,000 Class A common shares (G-Gift) on Nov 4, 2026, leaving 115,171 shares held. The gift was recorded at $0.00 per share.
Planet Labs PBC director Kristen Robinson sold 40,000 Class A common shares at $14.139 on Oct 15, 2026, leaving 182,897 shares owned.
Director Raymond John w reported selling 6,494 Class A common shares of Planet Labs PBC on 2026-10-13 at $15.2284 per share, leaving 30,620 shares owned.
Director Ita M Brennan sold 11,500 Class A Common Stock shares of Planet Labs PBC at $16.3025 per share on 2026-10-01, leaving 250,373 shares owned.
Planet Labs director and CEO William Spencer gifted 80,000 Class A common shares, leaving him with 2,488,473 shares directly owned.
CEO Spencer disposed of 134,642 Class A shares at $16.02 for tax withholding (Code F), leaving 2,568,473 owned.
Planet Labs CFO Ashley F. Johnson received an award of 5,588 Class A shares, had 87,944 shares withheld for tax at $16.02, moved 72,096 shares in an other transaction (disposed and acquired), and sold 55,663 shares at $16.9648.
Planet Labs director and Co-Founder Robert H. Schingler had 54,117 Class A shares withheld for taxes at $16.02, moved 52,240 shares between his own accounts, and sold 52,240 Class A shares at $16.9645.
Director Robert H. Schingler gifted 55,000 Class A common shares on 2026-08-05 at $0.00, leaving 170,171 owned after.
Planet Labs CFO Ashley F. Johnson sold 110,028 Class A shares at $22.0804 on July 23, 2026, and reported a 70,767-share J-Other transfer of Class A shares (both disposed and acquired legs at $0.00).
Director Kristen Robinson reported two other (J) entries of 37,107 Class A shares each and an open-market sale (S) of 37,107 Class A shares at $25.0529, leaving 222,897 shares owned.
Director Raymond John W. reported acquiring 43,608 shares of Planet Labs (PL) Class A Common Stock from a J-Other transaction on 2026-07-13, leaving 43,608 shares owned.
Planet Labs director and Co-Founder/Chief Strategy Officer Robert H. Schingler reported gifting 55,000 Class A common shares (G-Gift) on Nov 4, 2026, leaving 115,171 shares held. The gift was recorded at $0.00 per share.
Planet Labs PBC director Kristen Robinson sold 40,000 Class A common shares at $14.139 on Oct 15, 2026, leaving 182,897 shares owned.
Director Raymond John w reported selling 6,494 Class A common shares of Planet Labs PBC on 2026-10-13 at $15.2284 per share, leaving 30,620 shares owned.
Director Ita M Brennan sold 11,500 Class A Common Stock shares of Planet Labs PBC at $16.3025 per share on 2026-10-01, leaving 250,373 shares owned.
Planet Labs director and CEO William Spencer gifted 80,000 Class A common shares, leaving him with 2,488,473 shares directly owned.
CEO Spencer disposed of 134,642 Class A shares at $16.02 for tax withholding (Code F), leaving 2,568,473 owned.
Planet Labs CFO Ashley F. Johnson received an award of 5,588 Class A shares, had 87,944 shares withheld for tax at $16.02, moved 72,096 shares in an other transaction (disposed and acquired), and sold 55,663 shares at $16.9648.
Planet Labs director and Co-Founder Robert H. Schingler had 54,117 Class A shares withheld for taxes at $16.02, moved 52,240 shares between his own accounts, and sold 52,240 Class A shares at $16.9645.
Director Robert H. Schingler gifted 55,000 Class A common shares on 2026-08-05 at $0.00, leaving 170,171 owned after.
Planet Labs CFO Ashley F. Johnson sold 110,028 Class A shares at $22.0804 on July 23, 2026, and reported a 70,767-share J-Other transfer of Class A shares (both disposed and acquired legs at $0.00).
Director Kristen Robinson reported two other (J) entries of 37,107 Class A shares each and an open-market sale (S) of 37,107 Class A shares at $25.0529, leaving 222,897 shares owned.
Director Raymond John W. reported acquiring 43,608 shares of Planet Labs (PL) Class A Common Stock from a J-Other transaction on 2026-07-13, leaving 43,608 shares owned.
Robert H Schingler, Planet Labs director and Co-Founder/Chief Strategy Officer, sold 89,593 Class A common shares on the open market at $25.9197 per share, in two transactions on July 10, 2026.
Planet Labs CEO and co-founder William Spencer sold 200,000 Class A common shares at $25.9197 in one open-market sale, leaving 2,703,115 shares owned.
Director Gary B. Smith received two A-Award grants totaling 8,639 shares of Planet Labs PBC Class A Common Stock on 2026-07-09 at $0.00, per a Form 4 filed 2026-07-10.
Director Kristen Robinson received a grant (A-Award) of 6,479 Class A common shares of Planet Labs PBC on 2026-07-09 at $0.00, bringing her holding to 43,586 shares.
Director Reese Scott received awards totaling 8,639 Class A Common Stock shares (2 transactions) at $0.00, per Form 4 filed 2026-07-10.
Director Raymond John w received a 6,479-share Class A Common Stock award (A) from Planet Labs PBC on 2026-07-09, bringing his holdings to 50,087 shares.
Director Vijaya Gadde received a 6,479-share Class A common stock award from Planet Labs PBC on July 9, 2026, at $0.00 per share, and owns 256,648 shares after the grant.
Earnings calls
Planet Labs reported record Q2 FY2027 revenue of $116 million, approximately 58% year-over-year growth, with non-GAAP gross margin of 59% and adjusted EBITDA of $13.9 million. Defense and Intelligence revenue grew more than 90% year-over-year, commercial more than 15%, and civil government over 5%, with the quarter aided by handover of the first sovereign satellite for the Swedish Armed Forces. The company cited over $4 billion of identified satellite services opportunities, more than 25% of which is near-term pipeline, and announced new wins including an $8 million NGA contract and a German dedicated capacity tender award with a maximum value of EUR 25 million over five years. The company raised the low end of full-year FY2027 revenue guidance to $430-441 million, implying 40% to 43% growth, and expects CapEx of approximately $100-115 million for the year.
Earnings calls
Planet Labs reported record first quarter fiscal 2027 revenue of $94 million, representing approximately 42% year-over-year growth, with non-GAAP gross margin of 56%. The company achieved Rule of 40 for a third consecutive quarter and ended the period with approximately $906 million in backlog, up about 72% year over year. Defense & Intelligence revenue grew over 65% year on year, commercial grew over 20%, and civil government was roughly flat due to a NASA contract reduction. Planet signed an 8-figure one-year dedicated capacity deal with an international defense and intelligence customer and launched three Pelican satellites, including Sweden's first sovereign reconnaissance satellite four months after contract signing. The company raised full-year fiscal 2027 revenue guidance to $425 million to $441 million, about 41% growth at the midpoint.
No articles from Reuters, WSJ, Bloomberg or FT for this company in our feed.
Company data
Not comparable with the headline: the provider's history counts about 359.59M shares, the headline 340.35M. Shown as the provider reports it.
| Fund | Weight | Shares held |
|---|---|---|
| TWCUX | 0.68% | 11M |
| VTI | 0.01% | 7.1M |
| NJM | 0.35% | 6.4M |
| VB | 0.05% | 6.3M |
| JEDG.L | 4.05% | 4.9M |
| DFNG.L | 0.87% | 4.7M |
| VBK | 0.11% | 3.6M |
| VXF | 0.05% | 3.4M |
| SHLD | 0.6% | 2.5M |
| NLO | 0.66% | 2.2M |
| FSMAX | 0.06% | 2.1M |
| FSMDX | 0.04% | 1.7M |
How the analysts covering PL have done: ratings, price-target accuracy and the measured reaction after their calls.
| 12 months | 3 years | |
|---|---|---|
| Ratings | 65 | 178 |
| Analysts | 16 | 19 |
| Buy / hold / sell | 46 / 19 / 0 | 141 / 37 / 0 |
| Upgrades / downgrades / initiations | 0 / 0 / 5 | 1 / 3 / 7 |
| Price targets hit / missed | 0 / 64 (0%) | 87 / 75 (54%) |
| Avg. return after a rating (TipRanks) | -59.8% | +30.4% |
| Best / worst call | -14.4% / -80.1% | +426.5% / -80.1% |
After buy calls on this stock: not enough measured cases yet
| Date | Analyst | Call | Target | |
|---|---|---|---|---|
| Nov 20, 2026 | Kristine LiwagMorgan StanleyNov 20, 2026 | HoldMaintained | $19.00 | |
| Nov 19, 2026 | Patrick McCarthyOppenheimerNov 19, 2026 | BuyInitiated | $18.00↗ | article ↗ |
| Oct 16, 2026 | Kristine LiwagMorgan StanleyOct 16, 2026 | HoldMaintained | $19.00 | |
| Oct 11, 2026 | Noah PoponakGoldman SachsOct 11, 2026 | HoldMaintained | $22.00↗ | article ↗ |
| Oct 8, 2026 | Anthony ValentiniBarclaysOct 8, 2026 | HoldInitiated | $17.00↗ | article ↗ |
Share of analysts per call each month (latest call per analyst within 180 days). Targets and closes in USD.
TipRanks data · computed Nov 21, 2026 · 65 ratings
Planet Labs PBC (PL) perpetual futures trade on one crypto venue: Bitget. PerpEquities shows its live price, funding rate, open interest and liquidity.
Yes. Unlike the underlying stock, PL perpetuals trade 24/7 — including weekends and outside regular market hours.
Right now the PL perp funding rate is 0.0% annualized (one venue). A positive rate means longs pay shorts. PerpEquities shows the live rate and its history.
The venue-median PL perp mark is $10.7 versus a reference stock price of $10.7, a basis of 0.0%. Perps follow the stock through an index price; the gap widens when funding or liquidity diverge between venues.
A PL perpetual is a derivative that tracks the price of Planet Labs PBC with no expiry date. It lets you take long or short exposure to Planet Labs PBC on crypto venues, around the clock.
PLUSDT is the symbol most crypto exchanges use for the Planet Labs PBC perpetual settled in USDT (Tether). It tracks the PL share price through an index, trades 24/7 with leverage and never expires.
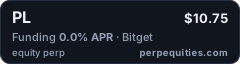
<a href="https://perpequities.com/stocks/pl-perp"><img src="https://perpequities.com/badge/pl-perp.svg" width="240" height="64" alt="PL perpetuals · perpequities.com" loading="lazy"></a>