PerpEquities

Equity · Financial services

KB Financial Group Inc. (KBFIN) perpetual futures

KBFIN perpetual futures on 1 crypto exchanges – live perp price vs the stock, funding rate, open interest and where to trade KBFINUSDT.

KB Financial Group Inc., headquartered in Seoul, South Korea, provides comprehensive banking and financial services to individual and corporate clients in South Korea and internationally.

$110.81-3.8%
Open in terminal

Price chart


Use the left and right arrow keys to inspect points on the chart.

Collecting venue price data...
venue perp mark · MEXC (KBFIN/USDT)
Auto: highest-volume live perp venueOpen in TradingView

Trading data

Perpetual market activity

1/1 live markets
Venues
1
Live markets
1/1
24h volume
$101.5K
Open interest
$573.5K
Best liquidity
$4.7K
MEXC
Tightest spread
+29.8 bps
MEXC
Highest volume
$101.5K
MEXC
Settlement mix
USDT · 1/1
Perp/spot vol.
0.00x
Spot volume $193.1M
OI / float
0.00%
Float $38.2B
Spot performance
1D-3.82%
5D-1.37%
1M-10.39%
6M-6.33%
YTD+22.47%
1Y+22.07%

Venue matrix

1 markets

Some venue links are sponsored. We may receive a commission, and eligible users may occasionally receive trading-fee discounts, at no additional cost to you.

Trade
MEXCTradeKBFIN/USDTTrading$110.81+15.8% APR
+0.014% every 8h
+29.8 bps$4.7K$101.5K$573.5KUSDT20x

Tradability

Execution quality

Entry cost and depth per venue at $1k–$100k

No sufficient depth · 0 of 1 venues absorb $10k

Too thin: MEXC

Taker execution estimate incl. approx. fees - maker fills are not guaranteed.

Best venues for this underlying

Best liquidity

KBFIN

Tightest spread

KBFIN

Highest volume

KBFIN

Funding history

Stored venue snapshots by market

Company financials

Financials at a glance

Last report Q3 '26 · filed 2026-09-30 · next report 2027-02-09 · Updated 19h ago
All financials →

Valuation & key figures

Market cap
$39.3B
Updated 19h ago
Revenue
$34.1B
Trailing 12 months
Revenue growth
-62%
Next fiscal year
Profit margin
+14.1%
P/E
8.3
Peer P/E -28.4
P/S
1.2
Peer P/E
-28.4
Similar listed perps
Free cash flow
-$10.9B
Trailing 12 months
Net income
$4.8B
Trailing 12 months
Revenue estimate
$14.2B
Next fiscal year
Earnings
2027-02-09
Revenue est. $3.2B · Updated 19h ago
Dividend
₩1.167K
2026-11-11
Revenue (TTM)₩46.2T+24.6% vs a year agoLast 4 quarters; bars = each quarter
Operating margin (TTM)20.2%-1.0 pp vs a year agoOperating income ₩9.31T
Net income (TTM)₩6.54T+12.6% vs a year agoAfter tax, incl. non-operating gains
Free cash flow (TTM)–– vs a year agoCapex –
Diluted EPS (TTM)₩18,111.58+20.1% vs a year agoSum of the last 4 quarters
Net cash-₩158T-1,339.9% vs a year agoCash + short-term investments - debt
  • Revenue growth slowing: -73.6% year on yearQ3 '26 revenue ₩2.35T, against an average of 40.9% over the four quarters before.
  • Operating margin 20.2% (TTM), -1.0 pp on a year agoOperating income grew 18.9% while revenue grew 24.6%.
  • Diluted share count down 3.0% in a year356M diluted shares in Q3 '26, 367M a year earlier.
  • Net debt ₩158TCash + short-term investments ₩0, debt incl. leases ₩158T; a year ago net debt ₩11T.

Revenue, operating income and growth

quarterly
In the full financialsIncome statement, balance sheet and cash flow (12 quarters / 10 years) · margins and cost structure · capital allocation and buybacks · valuation against the 5-year range · analyst estimates

Next catalyst

Catalysts

Earnings
2027-02-09
Revenue est. $3.2B · Updated 19h ago
Dividend
₩1.167K
2026-11-11

No unusual perp activity right now.

Reference data

Market context

Reference market

Closed
Korea Exchange
Regular hours
CLOSED – CLOSED
Next holiday
Dec 25, 2026 · Christmas

Research data

Analysts, filings and peer context

Estimates

6
DateEPS estimateRevenue estimateGrowthAnalysts
FY 202613.91$14.2B-62%9
FY 202715.00$14.7B-61%20
FY 202816.18$15.2B-59%10
Q3 20263.62$3.6B-45%4
Q4 20261.76$3.2B-81%3
Q1 20274.00$3.6B-49%3

Company events

6
2027-02-09EarningsActual - / Estimate 2,382.99-
2026-11-11Dividend₩1.167K-
2026-10-29EarningsActual 5,249.03 / Estimate 4,905.23Beat
2026-08-06Dividend₩1.155K-
2026-07-23EarningsActual 5,234.51 / Estimate 5,070.47Beat
2026-07-01Dividend₩3.46K-

Peer comparison

Similar listed perps
NameMarket capP/SP/EProfit marginVenues
COIN$35.7B6.3-51.4-12.5%27BTGO$528.2M0.0-5.3-0.6%1

Company data

Company intelligence

Updated: Nov 2, 2026, 05:01 PM UTC

Company profile

Sector
Financial Services
Industry
Banks - Regional
Chief executive
Jong Hee Yang
Employees
141
IPO date
Dec 25, 2001
Country
KR
Exchange
Korea Exchange
Website
Altman Z-scorei0.2
Piotroski scorei4/9
Overall ratingiC+
Owner earningsi-₩11.17T-₩31,217.86 per share

Rating factors

Return on equityi
1
Return on assetsi
1
Debt to equityi
1
Price to earningsi
3
Price to booki
1
Market cap history
₩54.57T-10.1%Aug 26 – Nov 26
₩52.37T₩58.68T₩65THigh: ₩65T · 2026-09-14Low: ₩52.37T · 2026-10-26Latest: ₩54.57T · 2026-11-02Aug 26Sep 26Oct 26Nov 26
Latest: ₩54.57T · 2026-11-02High: ₩65T · 2026-09-14Low: ₩52.37T · 2026-10-26
Largest fund holders
FundWeightShares held
VXUS0.09%5M
EWY2.13%4.2M
IEMG0.31%3.9M
WWK1.49%3.6M
VEA0.13%3.3M
069500.KS1.55%2.2M
VWIGX0.36%1.2M
498410.KS20.82%1.2M
EIMI.L0.3%1.1M
EIMU DE0.29%1.1M
EMXC0.43%960.6K
FLRK.L2.42%954.5K

Analyst track record

How the analysts covering KBFIN have done: ratings, price-target accuracy and the measured reaction after their calls.

12 months3 years
Ratings00
Analysts00
Buy / hold / sell––
Upgrades / downgrades / initiations0 / 0 / 00 / 0 / 0
Price targets hit / missed––
Avg. return after a rating (TipRanks)––
Best / worst call– / –– / –

After buy calls on this stock: not enough measured cases yet

TipRanks data · computed Nov 4, 2026 · 0 ratings

Frequently asked questions

Where can I trade KBFIN perpetual futures?

KB Financial Group Inc. (KBFIN) perpetual futures trade on 1 crypto venues, including MEXC. PerpEquities compares them by live price, funding rate, open interest and liquidity.

Can I trade KBFIN around the clock?

Yes. Unlike the underlying stock, KBFIN perpetuals trade 24/7 — including weekends and outside regular market hours.

What is the funding rate on KBFIN perpetuals?

Right now the KBFIN perp funding rate is +15.8% annualized (venue median), ranging from +15.8% to +15.8% across 1 venues. A positive rate means longs pay shorts. PerpEquities shows the live rate and its history for every venue.

How does the KBFIN perp price compare to the KB Financial Group Inc. stock?

The venue-median KBFIN perp mark is $110.8 versus a reference stock price of $110.8, a basis of 0.0%. Perps follow the stock through an index price; the gap widens when funding or liquidity diverge between venues.

What is a KBFIN perpetual future?

A KBFIN perpetual is a derivative that tracks the price of KB Financial Group Inc. with no expiry date. It lets you take long or short exposure to KB Financial Group Inc. on crypto venues, around the clock.

What is KBFINUSDT perpetual?

KBFINUSDT is the symbol most crypto exchanges use for the KB Financial Group Inc. perpetual settled in USDT (Tether). It tracks the KBFIN share price through an index, trades 24/7 with leverage and never expires.
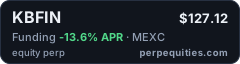
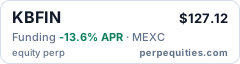
Embed this asset

KBFIN perpetuals · perpequities.comKBFIN perpetuals · perpequities.com
<a href="https://perpequities.com/stocks/kbfin-perp"><img src="https://perpequities.com/badge/kbfin-perp.svg" width="240" height="64" alt="KBFIN perpetuals · perpequities.com" loading="lazy"></a>

Next step

Stay on top of KBFIN perps

Signals with a track record

Analysts who hit 70%+ of their targets on the perps we track, congress buys over $500k, 13F positions over $5M, funding spreads that have paid for days. Every post shows the evidence. Free, no sign-up.

Join on Telegram

Weekly digest by email

The listings, funding and moves that matter for KBFIN — one email every Sunday.

Watchlist and alerts

Price and funding alerts for KBFIN, via push or Telegram.

Set an alert

Follow the live feed

Daily movers, new listings and funding extremes as they happen.

Follow on X