
Equity · Financial services
Antalpha Platform Holding Company (ANTA) perpetual futures
ANTA perpetual futures on 1 crypto exchange – live perp price vs the stock, funding rate, open interest and where to trade ANTAUSDT.
Antalpha Platform Holding Company provides financial, technological and risk management services for the digital asset sector, including supply chain financing and equipment loans collateralized by Bitcoin and mining hardware.
Price chart
Use the left and right arrow keys to inspect points on the chart.
Trading data
Perpetual market activity
1/1 live markets
Trading data
Perpetual market activity
Spot performance
 Bybit
Tradability
Execution quality
Entry cost and depth per venue at $1k–$100k
Tradability
Execution quality
Entry cost and depth per venue at $1k–$100kNo sufficient depth · 0 of 1 venues absorb $10k
No fresh book data: Bybit
Taker execution estimate incl. approx. fees - maker fills are not guaranteed.
Best venues for this underlying
Best liquidity
ANTATightest spread
ANTAHighest volume
ANTAFunding history
Stored venue snapshots by market
Funding history
Stored venue snapshots by marketNext catalyst
Catalysts
Next catalyst
Catalysts
No unusual perp activity right now.
Research data
Analysts, filings and peer context
Research data
Analysts, filings and peer context
Estimates
6Company events
6Peer comparison
Similar listed perpsAnalysts
Price targets in USD| Consensus rating | Buy |
|---|---|
| Average 12-month price target | $7.50 |
| 12-month target range (low – high) | $7.50 – $7.50 |
| Ratings in the provider's consensus | 1 |
Price targets as of 2026-11-22
Analyst rating history
Ratings| Month | Strong buy | Buy | Hold | Sell | Strong sell |
|---|---|---|---|---|---|
| Nov 2026 | 0 | 2 | 0 | 0 | 0 |
| Oct 2026 | 0 | 2 | 0 | 0 | 0 |
| Sep 2026 | 0 | 2 | 0 | 0 | 0 |
| Aug 2026 | 0 | 2 | 0 | 0 | 0 |
| Jul 2026 | 0 | 2 | 0 | 0 | 0 |
| Jun 2026 | 0 | 2 | 0 | 0 | 0 |
| May 2026 | 0 | 3 | 0 | 0 | 0 |
| Apr 2026 | 0 | 3 | 0 | 0 | 0 |
| Mar 2026 | 0 | 3 | 0 | 0 | 0 |
| Feb 2026 | 0 | 3 | 0 | 0 | 0 |
| Jan 2026 | 0 | 3 | 0 | 0 | 0 |
| Dec 2025 | 0 | 3 | 0 | 0 | 0 |
Ownership
Institutional · 2026-Q2Reference market activity
ANTA-PERPPrice performance
11Insider activity
FY2026 Q1Insider transactions
7Antalpha Platform Holding (ANTA) reported Wang Yang's Form 3 filing dated 2026-03-18 with one reported transaction: 0 shares at $0.00, with 0 shares held after. No purchase, sale, grant, conversion or option exercise was disclosed in this filing.
Antalpha Platform CEO Jin Xin reported holdings on an initial Form 3 filing: options to buy shares at $0.01 and $0.04, plus 750,000 Class A ordinary shares.
Antalpha Platform Holding CFO Liang Guanning filed Form 3 on 2026-03-16 reporting 45,000 options (right to buy) at a $0.04 strike, with no shares acquired in the reported transaction.
Antalpha Platform Holding Company (ANTA) director Islim Derar filed a Form 3 on 2026-03-13 reporting initial ownership, listing 0 shares of common stock at $0.00 acquired in 1 transaction and 0 shares owned after.
Antalpha Platform Holding (ANTA) insiders filed Form 3 on 2026-03-12, reporting no share transactions (0 shares, $0.00).
Filings
24 · Latest SEC filingsAntalpha Platform Holding (ANTA) reported Wang Yang's Form 3 filing dated 2026-03-18 with one reported transaction: 0 shares at $0.00, with 0 shares held after. No purchase, sale, grant, conversion or option exercise was disclosed in this filing.
Antalpha Platform CEO Jin Xin reported holdings on an initial Form 3 filing: options to buy shares at $0.01 and $0.04, plus 750,000 Class A ordinary shares.
Antalpha Platform Holding CFO Liang Guanning filed Form 3 on 2026-03-16 reporting 45,000 options (right to buy) at a $0.04 strike, with no shares acquired in the reported transaction.
Antalpha Platform Holding Company (ANTA) director Islim Derar filed a Form 3 on 2026-03-13 reporting initial ownership, listing 0 shares of common stock at $0.00 acquired in 1 transaction and 0 shares owned after.
Antalpha Platform Holding (ANTA) insiders filed Form 3 on 2026-03-12, reporting no share transactions (0 shares, $0.00).
Transcripts
Earnings callsFY2026 Q22026-08-19
Earnings calls
AI summary
mixedAntalpha reported Q2 2026 total revenue of $12.2 million, ahead of the midpoint of guidance but down 28% year over year; excluding the largely repaid Cango facility, revenue declined 15% as financing activity moderated. The company reported a net loss attributable to Antalpha of $12.5 million and an adjusted EBITDA loss of $27.4 million, largely due to unrealized losses on XAUt and XAUE holdings. Antalpha Prime generated stand-alone revenue of $12.2 million and operated profitably on a stand-alone GAAP basis, while Aurelion contributed an operating loss of about $24.4 million driven by XAUt fair value declines. Management said it remains selective in deploying capital, maintained its record of zero principal loss since inception, and cited early progress at Nina, its Web3 AI initiative, with several thousand registered users. For Q3 2026, the company expects revenue between $10 million and $12 million.
Key takeaways
- Revenue fell 28% year over year to $12.2 million, but was ahead of the midpoint of guidance; excluding the Cango facility, revenue declined 15%.
- Total value of loans facilitated was $1.35 billion as of June 30, down from $1.71 billion at the end of the first quarter, reflecting measured market activity and selective capital deployment.
- Hash rate financing reached approximately 30.9 exahash, about 3.1% of the global Bitcoin network hash rate at quarter end.
- Nina, the company's Web3 AI initiative, reached several thousand registered users across its website and iOS and Android apps, with the majority completing at least one core product interaction.
- Antalpha Prime operated profitably on a stand-alone GAAP basis; excluding a $3.9 million XAUE fair value loss, Prime generated $0.6 million of adjusted EBITDA.
Financial highlights
- Total revenue was $12.2 million, down 28% year over year, with technology financing fees of $7.7 million (down 40%) and technology platform fees of $4.5 million (up 10%).
- Operating expenses excluding fair value loss on crypto assets were $15 million, down 14% year over year, including $5.3 million of funding costs and about $1.3 million of noncash equity-based compensation.
- GAAP operating loss was $25.1 million and non-GAAP operating loss was $23.8 million; net loss attributable to Antalpha was $12.5 million versus net income of $0.7 million a year earlier.
- Adjusted EBITDA loss was $27.4 million, including about $26.2 million of unrealized loss on XAUt and XAUE holdings; excluding those fair value movements, adjusted EBITDA loss was $1.2 million.
Guidance
- The company expects third quarter 2026 revenue between $10 million and $12 million.
- Management said it will continue to allocate capital selectively and maintain prudent underwriting standards amid a muted financing environment.
Q&A themes
- Yield earned on XAUE holdings is recorded in the nonoperating part of the financial statements rather than as revenue, and the yield this quarter was not significant.
- Management did not specify a Bitcoin price level needed for customers to resume fleet reinvestment, citing a conservative stance and case-by-case customer mining economics.
- Nina remains in an early validation stage, with focus on usability, engagement and retention before expanding functionality; users engage broadly on topics such as Bitcoin trends and popular applications.
- Risk mitigation combines careful underwriting, overcollateralization, active collateral management and client engagement, with mined Bitcoin deposited into a control wallet as additional protection.
Risks
- Reported results were significantly affected by unrealized fair value losses on XAUt and XAUE holdings, including about $22.3 million at Aurelion as XAUt fell from approximately $4,667 to approximately $3,996 per unit during the quarter.
- Loan facilitation declined to $1.35 billion from $1.71 billion at the prior quarter end amid a muted financing environment, and management said recovery pace depends on opportunities actually seen.
- Management said no credit model is perfect, while noting capital is available to deploy when risk-adjusted return and collateral conditions are met.
Company news
Reuters, WSJ, Bloomberg and FT first, as far as our news provider delivers them; other publishers behind the second filter. Headlines link to the publisher.No articles from Reuters, WSJ, Bloomberg or FT for this company in our feed.
Company data
Company intelligence
Updated: Nov 22, 2026, 08:00 AM UTC
Company data
Company intelligence
Company profile
- Sector
- Financial Services
- Industry
- Financial - Credit Services
- Chief executive
- Xin Jin
- Employees
- 113
- IPO date
- May 14, 2025
- Country
- SG
- Exchange
- NASDAQ Global Market
Rating factors
- Return on equityi
- 2/5
- Return on assetsi
- 1/5
- Debt to equityi
- 1/5
- Price to earningsi
- 1/5
- Price to booki
- 3/5
Company press releases
Market cap history
Largest fund holders
| Fund | Weight | Shares held |
|---|---|---|
| FNCMX | 0% | 17.1K |
Analyst track record
How the analysts covering ANTA have done: ratings, price-target accuracy and the measured reaction after their calls.
| 12 months | 3 years | |
|---|---|---|
| Ratings | 5 | 16 |
| Analysts | 2 | 3 |
| Buy / hold / sell | 5 / 0 / 0 | 16 / 0 / 0 |
| Upgrades / downgrades / initiations | 0 / 0 / 0 | 0 / 0 / 3 |
| Price targets hit / missed | 0 / 5 (0%) | 0 / 16 (0%) |
| Avg. return after a rating (TipRanks) | -77.9% | -84.8% |
| Best / worst call | -70.8% / -81.8% | -70.8% / -89.1% |
After buy calls on this stock: not enough measured cases yet
Latest ratings
| Date | Analyst | Call | Target | |
|---|---|---|---|---|
| Aug 20, 2026 | Hal GoetschB. Riley SecuritiesAug 20, 2026 | BuyMaintained | $7.50↗ | article ↗ |
| May 20, 2026 | Hal GoetschB. Riley SecuritiesMay 20, 2026 | BuyReiterated | $9.50↗ | article ↗ |
| Mar 4, 2026 | Hal GoetschB. Riley SecuritiesMar 4, 2026 | BuyMaintained | $10.00↗ | article ↗ |
| Mar 4, 2026 | Darren AftahiLucid CapitalMar 4, 2026 | BuyMaintained | $12.00↗ | article ↗ |
| Nov 12, 2025 | Ed EngelCompass PointNov 12, 2025 | BuyMaintained | $20.00↗ | article ↗ |
Share of analysts per call each month (latest call per analyst within 180 days). Targets and closes in USD.
TipRanks data · computed Nov 17, 2026 · 5 ratings
Frequently asked questions
Where can I trade ANTA perpetual futures?
Antalpha Platform Holding Company (ANTA) perpetual futures trade on one crypto venue: Bybit. PerpEquities shows its live price, funding rate, open interest and liquidity.
Can I trade ANTA around the clock?
Yes. Unlike the underlying stock, ANTA perpetuals trade 24/7 — including weekends and outside regular market hours.
What is the funding rate on ANTA perpetuals?
Right now the ANTA perp funding rate is 0.0% annualized (one venue). A positive rate means longs pay shorts. PerpEquities shows the live rate and its history.
How does the ANTA perp price compare to the Antalpha Platform Holding Company stock?
The venue-median ANTA perp mark is $1.41 versus a reference stock price of $1.41, a basis of 0.0%. Perps follow the stock through an index price; the gap widens when funding or liquidity diverge between venues.
What is a ANTA perpetual future?
A ANTA perpetual is a derivative that tracks the price of Antalpha Platform Holding Company with no expiry date. It lets you take long or short exposure to Antalpha Platform Holding Company on crypto venues, around the clock.
What is ANTAUSDT perpetual?
ANTAUSDT is the symbol most crypto exchanges use for the Antalpha Platform Holding Company perpetual settled in USDT (Tether). It tracks the ANTA share price through an index, trades 24/7 with leverage and never expires.
Embed this asset
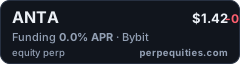
<a href="https://perpequities.com/stocks/anta-perp"><img src="https://perpequities.com/badge/anta-perp.svg" width="240" height="64" alt="ANTA perpetuals · perpequities.com" loading="lazy"></a>