PerpEquities

Equity

The Allstate Corporation (ALL) perpetual futures

ALL perpetual futures on 1 crypto exchanges – live perp price vs the stock, funding rate, open interest and where to trade ALLUSDT.

The Allstate Corporation provides property, casualty and other insurance, along with protection plans and health and benefits products, in the United States and Canada.

$245.15+3.5%NYSE open
Open in terminal

Price chart

Interactive TradingView chart

TradingView symbol NYSE:ALL

Loads TradingView's third-party widget (about 1 MB) on demand.

Auto: underlying reference priceOpen in TradingView

Trading data

Perpetual market activity

1/1 live markets
Venues
1
Live markets
1/1
24h volume
$17.4K
Open interest
$37.4K
Best liquidity
$63.2K
MEXC
Tightest spread
+3.7 bps
MEXC
Highest volume
$17.4K
MEXC
Settlement mix
USDT · 1/1
Perp/spot vol.
0.00x
Spot volume $858M
OI / float
0.00%
Float $61.7B
Spot performance
1D+3.46%
5D+6.62%
1M-0.78%
6M+14.67%
YTD+19.09%
1Y+27.91%

Venue matrix

1 markets

Some venue links are sponsored. We may receive a commission, and eligible users may occasionally receive trading-fee discounts, at no additional cost to you.

Trade
MEXCTradeALLSTOCK/USDTTrading$245.15+7.1% APR
+0.00650% every 8h
+3.7 bps$63.2K$17.4K$37.4KUSDT20x

Tradability

Execution quality

Entry cost and depth per venue at $1k–$100k

Thin liquidity · 1 of 1 venues absorb $10k · Typical cost: +17.6 bps

Cheapest execution: MEXC · +17.6 bps

Taker execution estimate incl. approx. fees - maker fills are not guaranteed.

Best venues for this underlying

Funding history

Stored venue snapshots by market

Company data

Company fundamentals

Updated 2h ago
Market cap
$61.8B
Updated 2h ago
Revenue
$69.2B
Trailing 12 months
Revenue growth
-8%
Next fiscal year
Profit margin
+19.2%
P/E
4.8
Peer P/E 37.8
Free cash flow
$12.2B
Trailing 12 months
More metrics
Net income
$13.3B
Trailing 12 months
P/S
0.9
Peer P/E
37.8
Similar listed perps
Revenue estimate
$61B
Next fiscal year
Earnings
2026-11-04
Revenue est. $15.8B · Updated 2h ago
Dividend
$1.08
2026-08-31

Fundamental detail

Annual + quarterly
Latest revenue$66.5B
Net margin+15.5%
Free cash flow$9.9B
Net debt$6.8B
2020$41.7B
2021$48.7B
2022$50.6B
2023$56.6B
2024$63.5B
2025$66.5B
PeriodRevenueGrowthNet incomeFCF
2020$41.7B+1%$5.6B$5.2B
2021$48.7B+17%$1.6B$4.8B
2022$50.6B+4%-$1.3B$4.7B
2023$56.6B+12%-$188M$4B
2024$63.5B+12%$4.7B$8.7B
2025$66.5B+5%$10.3B$9.9B
PeriodGross marginOperating marginNet marginROEROA
2020+31.2%+16.3%+13.4%+18.5%+4.4%
2021+24.7%+13.3%+3.3%+6.4%+1.6%
2022+11.2%-3.6%-2.5%-7.4%-1.3%
2023+12.7%-0.6%-0.3%-1.1%-0.2%
2024+22.8%+9.1%+7.3%+21.8%+4.2%
2025+33.2%+19.8%+15.5%+33.6%+8.6%
PeriodCashDebtNet debtCurrent ratio
2020$311M$7.8B$7.5B0.00
2021$763M$8B$7.2B0.00
2022$736M$8B$7.2B0.00
2023$722M$7.9B$7.2B0.00
2024$704M$8.1B$7.4B0.00
2025$678M$7.5B$6.8B0.37
PeriodMarket capEnterprise valueP/SP/E
2020$34.3B$41.8B0.86.3
2021$34.7B$41.9B0.723.3
2022$36.8B$44B0.7-27.0
2023$36.7B$44B0.6-116.6
2024$51B$58.3B0.811.2
2025$54.4B$61.2B0.85.4
Q3 2024$16.5B
Q4 2024$16.3B
Q1 2025$16.3B
Q2 2025$16.5B
Q3 2025$17.1B
Q4 2025$16.6B
Q1 2026$16.9B
Q2 2026$18.6B
PeriodRevenueGrowthNet incomeFCF
Q3 2024$16.5B+15%$1.2B$3.1B
Q4 2024$16.3B+11%$1.9B$1.7B
Q1 2025$16.3B+8%$595M$1.9B
Q2 2025$16.5B+6%$2.1B$1.9B
Q3 2025$17.1B+3%$3.7B$3.2B
Q4 2025$16.6B+2%$3.8B$2.9B
Q1 2026$16.9B+4%$2.5B$3.5B
Q2 2026$18.6B+12%$3.3B$2.6B
PeriodGross marginOperating marginNet marginROEROA
Q3 2024+22.6%+8.6%+7.2%+5.7%+1.0%
Q4 2024+30.1%+15.0%+11.8%+9.0%+1.7%
Q1 2025+18.6%+4.4%+3.7%+2.7%+0.5%
Q2 2025+24.4%+16.3%+12.7%+8.8%+1.8%
Q3 2025+36.6%+28.2%+22.0%+13.6%+3.1%
Q4 2025+53.0%+29.6%+23.1%+12.5%+3.2%
Q1 2026+45.3%+18.9%+14.5%+7.8%+2.0%
Q2 2026+34.7%+22.8%+17.6%+9.7%+2.6%
PeriodCashDebtNet debtCurrent ratio
Q3 2024$816M$8.1B$7.3B0.00
Q4 2024$704M$8.1B$7.4B0.00
Q1 2025$840M$8.1B$7.2B0.41
Q2 2025$995M$8.1B$7.1B0.45
Q3 2025$931M$8.1B$7.2B0.43
Q4 2025$678M$7.5B$6.8B0.37
Q1 2026$697M$7.5B$6.8B0.38
Q2 2026$840M$7.5B$6.7B0.24
PeriodMarket capEnterprise valueP/SP/E
Q3 2024$50.2B$57.4B3.010.8
Q4 2024$51.1B$58.5B3.16.7
Q1 2025$54.7B$62B3.424.2
Q2 2025$53.3B$60.4B3.26.4
Q3 2025$56.5B$63.6B3.33.8
Q4 2025$54.4B$61.2B3.33.6
Q1 2026$53.8B$60.6B3.25.5
Q2 2026$60.9B$67.6B3.34.7

Refreshed 2h ago

Charts: revenue, profit, cash flow & valuation
Revenue$18.6BQ2 2026
$4.6B$9.3B$13.9B$18.6BQ3 2023: $14.3BQ4 2023: $14.8BQ1 2024: $15.1BQ2 2024: $15.6BQ3 2024: $16.5BQ4 2024: $16.3BQ1 2025: $16.3BQ2 2025: $16.5BQ3 2025: $17.1BQ4 2025: $16.6BQ1 2026: $16.9BQ2 2026: $18.6BQ3 2023Q2 2026
Net income$3.3BQ2 2026
$954.3M$1.9B$2.9B$3.8BQ3 2023: -$5MQ4 2023: $1.5BQ1 2024: $1.2BQ2 2024: $331MQ3 2024: $1.2BQ4 2024: $1.9BQ1 2025: $595MQ2 2025: $2.1BQ3 2025: $3.7BQ4 2025: $3.8BQ1 2026: $2.5BQ2 2026: $3.3BQ3 2023Q2 2026
EBITDA$4.3BQ2 2026
$1.3B$2.6B$3.8B$5.1BQ3 2023: $243MQ4 2023: $2.1BQ1 2024: $1.7BQ2 2024: $660MQ3 2024: $1.7BQ4 2024: $2.7BQ1 2025: $951MQ2 2025: $2.9BQ3 2025: $5BQ4 2025: $5.1BQ1 2026: $3.3BQ2 2026: $4.3BQ3 2023Q2 2026
Free cash flow$2.6BQ2 2026
$880.5M$1.8B$2.6B$3.5BQ3 2023: $1.2BQ4 2023: $1.2BQ1 2024: $1.6BQ2 2024: $2.3BQ3 2024: $3.1BQ4 2024: $1.7BQ1 2025: $1.9BQ2 2025: $1.9BQ3 2025: $3.2BQ4 2025: $2.9BQ1 2026: $3.5BQ2 2026: $2.6BQ3 2023Q2 2026
EPS$12.5Q2 2026
$3.48$7.11$10.7$14.4Q3 2023: -$0.16Q4 2023: $5.57Q1 2024: $4.46Q2 2024: $1.13Q3 2024: $4.33Q4 2024: $7.07Q1 2025: $2.11Q2 2025: $7.76Q3 2025: $14Q4 2025: $14.4Q1 2026: $9.25Q2 2026: $12.5Q3 2023Q2 2026
Cash / Debt$840MQ2 2026
$2B$4B$6.1B$8.1BQ3 2023 · Cash: $860MQ3 2023 · Debt: $7.9BQ4 2023 · Cash: $722MQ4 2023 · Debt: $7.9BQ1 2024 · Cash: $850MQ1 2024 · Debt: $7.9BQ2 2024 · Cash: $599MQ2 2024 · Debt: $8.1BQ3 2024 · Cash: $816MQ3 2024 · Debt: $8.1BQ4 2024 · Cash: $704MQ4 2024 · Debt: $8.1BQ1 2025 · Cash: $840MQ1 2025 · Debt: $8.1BQ2 2025 · Cash: $995MQ2 2025 · Debt: $8.1BQ3 2025 · Cash: $931MQ3 2025 · Debt: $8.1BQ4 2025 · Cash: $678MQ4 2025 · Debt: $7.5BQ1 2026 · Cash: $697MQ1 2026 · Debt: $7.5BQ2 2026 · Cash: $840MQ2 2026 · Debt: $7.5BQ3 2023Q2 2026
CashDebt
Profitability+34.7%Q2 2026
+13.1%+26.4%+39.7%+53.0%Q3 2023 · Gross margin: +13.8%Q4 2023 · Gross margin: +25.8%Q1 2024 · Gross margin: +22.0%Q2 2024 · Gross margin: +16.2%Q3 2024 · Gross margin: +22.6%Q4 2024 · Gross margin: +30.1%Q1 2025 · Gross margin: +18.6%Q2 2025 · Gross margin: +24.4%Q3 2025 · Gross margin: +36.6%Q4 2025 · Gross margin: +53.0%Q1 2026 · Gross margin: +45.3%Q2 2026 · Gross margin: +34.7%Q3 2023 · Operating margin: -0.1%Q4 2023 · Operating margin: +12.4%Q1 2024 · Operating margin: +9.7%Q2 2024 · Operating margin: +2.8%Q3 2024 · Operating margin: +8.6%Q4 2024 · Operating margin: +15.0%Q1 2025 · Operating margin: +4.4%Q2 2025 · Operating margin: +16.3%Q3 2025 · Operating margin: +28.2%Q4 2025 · Operating margin: +29.6%Q1 2026 · Operating margin: +18.9%Q2 2026 · Operating margin: +22.8%Q3 2023 · Net margin: 0.0%Q4 2023 · Net margin: +10.1%Q1 2024 · Net margin: +8.1%Q2 2024 · Net margin: +2.1%Q3 2024 · Net margin: +7.2%Q4 2024 · Net margin: +11.8%Q1 2025 · Net margin: +3.7%Q2 2025 · Net margin: +12.7%Q3 2025 · Net margin: +22.0%Q4 2025 · Net margin: +23.1%Q1 2026 · Net margin: +14.5%Q2 2026 · Net margin: +17.6%Q3 2023Q2 2026
Gross marginOperating marginNet margin
Revenue growth+12.4%Q2 2026
+3.8%+7.6%+11.4%+15.3%Q3 2024: +15.3%Q4 2024: +10.6%Q1 2025: +8.0%Q2 2025: +5.9%Q3 2025: +3.4%Q4 2025: +1.5%Q1 2026: +4.2%Q2 2026: +12.4%Q3 2023Q2 2026
Shares outstanding259.1MQ2 2026
67.2M134.4M201.5M268.7MQ3 2023: 261.8MQ4 2023: 264.7MQ1 2024: 266.5MQ2 2024: 267.1MQ3 2024: 268MQ4 2024: 268.7MQ1 2025: 267.8MQ2 2025: 267.9MQ3 2025: 266.4MQ4 2025: 264.7MQ1 2026: 262.6MQ2 2026: 259.1MQ3 2023Q2 2026
Valuation4.7Q2 2026
-124.6-71.3-18.135.2Q3 2023 · P/E: -177.8Q4 2023 · P/E: 6.3Q1 2024 · P/E: 9.6Q2 2024 · P/E: 35.2Q3 2024 · P/E: 10.8Q4 2024 · P/E: 6.7Q1 2025 · P/E: 24.2Q2 2025 · P/E: 6.4Q3 2025 · P/E: 3.8Q4 2025 · P/E: 3.6Q1 2026 · P/E: 5.5Q2 2026 · P/E: 4.7Q3 2023 · P/S: 2.0Q4 2023 · P/S: 2.5Q1 2024 · P/S: 3.0Q2 2024 · P/S: 2.7Q3 2024 · P/S: 3.0Q4 2024 · P/S: 3.1Q1 2025 · P/S: 3.4Q2 2025 · P/S: 3.2Q3 2025 · P/S: 3.3Q4 2025 · P/S: 3.3Q1 2026 · P/S: 3.2Q2 2026 · P/S: 3.3Q3 2023Q2 2026
P/EP/S
Revenue$66.5B2025
$16.6B$33.2B$49.8B$66.5B2018: $39.8B2019: $41.1B2020: $41.7B2021: $48.7B2022: $50.6B2023: $56.6B2024: $63.5B2025: $66.5B20182025
Net income$10.3B2025
$1.6B$4.5B$7.4B$10.3B2018: $2.2B2019: $4.8B2020: $5.6B2021: $1.6B2022: -$1.3B2023: -$188M2024: $4.7B2025: $10.3B20182025
EBITDA$14B2025
$3B$6.7B$10.4B$14B2018: $3.5B2019: $6.4B2020: $7.8B2021: $7.9B2022: -$648M2023: $735M2024: $6.7B2025: $14B20182025
Free cash flow$9.9B2025
$2.5B$4.9B$7.4B$9.9B2018: $4.9B2019: $4.7B2020: $5.2B2021: $4.8B2022: $4.7B2023: $4B2024: $8.7B2025: $9.9B20182025
EPS$38.22025
$5.77$16.6$27.4$38.22018: $6.122019: $142020: $17.32021: $4.962022: -$5.032023: -$1.22024: $172025: $38.220182025
Cash / Debt$678M2025
$2B$4B$6.1B$8.1B2018 · Cash: $499M2018 · Debt: $6.5B2019 · Cash: $338M2019 · Debt: $6.6B2020 · Cash: $311M2020 · Debt: $7.8B2021 · Cash: $763M2021 · Debt: $8B2022 · Cash: $736M2022 · Debt: $8B2023 · Cash: $722M2023 · Debt: $7.9B2024 · Cash: $704M2024 · Debt: $8.1B2025 · Cash: $678M2025 · Debt: $7.5B20182025
CashDebt
Profitability+33.2%2025
+5.6%+14.8%+24.0%+33.2%2018 · Gross margin: +23.1%2019 · Gross margin: +27.1%2020 · Gross margin: +31.2%2021 · Gross margin: +24.7%2022 · Gross margin: +11.2%2023 · Gross margin: +12.7%2024 · Gross margin: +22.8%2025 · Gross margin: +33.2%2018 · Operating margin: +6.6%2019 · Operating margin: +13.2%2020 · Operating margin: +16.3%2021 · Operating margin: +13.3%2022 · Operating margin: -3.6%2023 · Operating margin: -0.6%2024 · Operating margin: +9.1%2025 · Operating margin: +19.8%2018 · Net margin: +5.4%2019 · Net margin: +11.8%2020 · Net margin: +13.4%2021 · Net margin: +3.3%2022 · Net margin: -2.5%2023 · Net margin: -0.3%2024 · Net margin: +7.3%2025 · Net margin: +15.5%20182025
Gross marginOperating marginNet margin
Revenue growth+4.6%2025
+4.2%+8.4%+12.6%+16.8%2019: +3.2%2020: +1.4%2021: +16.8%2022: +4.0%2023: +11.8%2024: +12.2%2025: +4.6%20182025
Shares outstanding264.7M2025
88.3M176.6M264.9M353.2M2018: 353.2M2019: 333.5M2020: 315.5M2021: 299.1M2022: 271.2M2023: 262.5M2024: 267.8M2025: 264.7M20182025
Valuation5.42025
-81.7-46.7-11.723.32018 · P/E: 13.32019 · P/E: 7.92020 · P/E: 6.32021 · P/E: 23.32022 · P/E: -27.02023 · P/E: -116.62024 · P/E: 11.22025 · P/E: 5.42018 · P/S: 0.72019 · P/S: 0.92020 · P/S: 0.82021 · P/S: 0.72022 · P/S: 0.72023 · P/S: 0.62024 · P/S: 0.82025 · P/S: 0.820182025
P/EP/S

Next catalyst

Catalysts

Earnings
2026-11-04
Revenue est. $15.8B · Updated 2h ago
Dividend
$1.08
2026-08-31

No unusual perp activity right now.

Research data

Analysts, filings and peer context

Estimates

6
DateEPS estimateRevenue estimateGrowthAnalysts
FY 202635.91$61B-8%14
FY 202728.05$62.1B-7%13
FY 202826.61$64.1B-4%4
Q1 20277.99$14.8B-13%8
Q2 20274.82$15.7B-16%6
Q3 20276.07$16.4B-4%6

Company events

6
2026-11-04EarningsActual - / Estimate 6.86-
2026-08-31Dividend$1.08-
2026-08-05EarningsActual 8.99 / Estimate 6.06Beat
2026-06-01Dividend$1.08-
2026-04-29EarningsActual 10.65 / Estimate 7.31Beat
2026-03-02Dividend$1.08-

Peer comparison

Similar listed perps

Analyst track record

How the analysts covering ALL have done: ratings, price-target accuracy and the measured reaction after their calls.

12 months3 years
Ratings161459
Analysts2327
Buy / hold / sell82 / 58 / 21305 / 99 / 55
Upgrades / downgrades / initiations3 / 10 / 111 / 13 / 8
Price targets hit / missed68 / 80 (46%)324 / 109 (75%)
Avg. return after a rating (TipRanks)+0.6%+17.1%
Best / worst call+25.8% / -27.1%+147.9% / -27.1%

After buy calls on this stock: not enough measured cases yet

Latest ratings

DateAnalystCallTarget
Oct 16, 2026Bob HuangMorgan StanleyHoldReiterated$240
Oct 16, 2026Elyse GreenspanWells FargoHoldReiterated$236
Oct 16, 2026Meyer ShieldsKBWSellMaintained$232
Oct 12, 2026Elyse GreenspanWells FargoHoldUpgraded$236
Oct 12, 2026Joshua ShankerBank of America SecuritiesBuyMaintained$340

TipRanks data via FMP · computed Oct 19, 2026 · 161 ratings

Frequently asked questions

Where can I trade ALL perpetual futures?

The Allstate Corporation (ALL) perpetual futures trade on 1 crypto venues, including MEXC. PerpEquities compares them by live price, funding rate, open interest and liquidity.

Can I trade ALL around the clock?

Yes. Unlike the underlying stock, ALL perpetuals trade 24/7 — including weekends and outside regular market hours.

What is the funding rate on ALL perpetuals?

Right now the ALL perp funding rate is +7.1% annualized (venue median), ranging from +7.1% to +7.1% across 1 venues. A positive rate means longs pay shorts. PerpEquities shows the live rate and its history for every venue.

How does the ALL perp price compare to the The Allstate Corporation stock?

The venue-median ALL perp mark is $245.2 versus a reference stock price of $245.2, a basis of 0.0%. Perps follow the stock through an index price; the gap widens when funding or liquidity diverge between venues.

What is a ALL perpetual future?

A ALL perpetual is a derivative that tracks the price of The Allstate Corporation with no expiry date. It lets you take long or short exposure to The Allstate Corporation on crypto venues, around the clock.

What is ALLUSDT perpetual?

ALLUSDT is the symbol most crypto exchanges use for the The Allstate Corporation perpetual settled in USDT (Tether). It tracks the ALL share price through an index, trades 24/7 with leverage and never expires.

Embed this asset

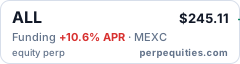
ALL perpetuals · perpequities.comALL perpetuals · perpequities.com
<a href="https://perpequities.com/stocks/all-perp"><img src="https://perpequities.com/badge/all-perp.svg" width="240" height="64" alt="ALL perpetuals · perpequities.com" loading="lazy"></a>

Next step

Stay on top of ALL perps

Signals with a track record

Analysts who hit 70%+ of their targets on the perps we track, congress buys over $500k, 13F positions over $5M, funding spreads that have paid for days. Every post shows the evidence. Free, no sign-up.

Join on Telegram

Weekly digest by email

The listings, funding and moves that matter for ALL — one email every Sunday.

Watchlist and alerts

Price and funding alerts for ALL, via push or Telegram.

Set an alert

Follow the live feed

Daily movers, new listings and funding extremes as they happen.

Follow on X