
Equity · Communication services
Vodafone Group Public Limited Company (VOD) perpetual futures
VOD perpetual futures on 1 crypto exchange – live perp price vs the stock, funding rate, open interest and where to trade VODUSDT.
Vodafone Group is a global telecommunications company providing mobile and fixed-line services, converged offerings, IoT solutions, and the M-Pesa payment platform.
Price chart
Use the left and right arrow keys to inspect points on the chart.
Trading data
Perpetual market activity
1/1 live markets
Trading data
Perpetual market activity
Spot performance
Venue matrix
1 markets
Some venue links are sponsored. We may receive a commission, and eligible users may occasionally receive trading-fee discounts, at no additional cost to you.
| Trade | ||||||||||||
|---|---|---|---|---|---|---|---|---|---|---|---|---|
 Helix (Injective) | Trade | VOD/USDC | Trading | $15.38 | +3.6% APR +0.00042% every 1h | - | $0 | - | - | USDC | 12x |
Tradability
Execution quality
Entry cost and depth per venue at $1k–$100k
Tradability
Execution quality
Entry cost and depth per venue at $1k–$100kNo sufficient depth · 0 of 1 venues absorb $10k
No fresh book data: Helix (Injective)
Taker execution estimate incl. approx. fees - maker fills are not guaranteed.
Best venues for this underlying
Best liquidity
VODTightest spread
-Highest volume
-Funding history
Stored venue snapshots by market
Funding history
Stored venue snapshots by marketNext catalyst
Catalysts
Next catalyst
Catalysts
No unusual perp activity right now.
Research data
Analysts, filings and peer context
Research data
Analysts, filings and peer context
Estimates
6Company events
6Peer comparison
Similar listed perpsAnalysts
Price targets in USD| Consensus rating | Buy |
|---|---|
| Average 12-month price target | $20.93 |
| 12-month target range (low – high) | $20.93 – $20.93 |
| Ratings in the provider's consensus | 25 |
Price targets as of 2026-11-15
Analyst rating history
Ratings| Month | Strong buy | Buy | Hold | Sell | Strong sell |
|---|---|---|---|---|---|
| Nov 2026 | 1 | 2 | 1 | 0 | 2 |
| Oct 2026 | 1 | 2 | 0 | 0 | 2 |
| Sep 2026 | 1 | 1 | 0 | 1 | 2 |
| Aug 2026 | 1 | 0 | 1 | 1 | 2 |
| Jul 2026 | 1 | 0 | 2 | 1 | 3 |
| Jun 2026 | 0 | 0 | 2 | 1 | 3 |
| May 2026 | 0 | 0 | 1 | 2 | 3 |
| Apr 2026 | 0 | 0 | 1 | 2 | 2 |
| Mar 2026 | 0 | 0 | 1 | 2 | 2 |
| Feb 2026 | 0 | 0 | 2 | 2 | 1 |
| Jan 2026 | 0 | 0 | 2 | 1 | 1 |
| Dec 2025 | 0 | 0 | 2 | 1 | 1 |
Ownership
Institutional · 2026-Q3Reference market activity
VOD-PERPPrice performance
11Insider activity
FY2024 Q1Insider transactions
1Vodafone Ventures Ltd reported an open-market purchase of 25M shares of 5.5% Convertible Note due 2034 at $5.75 per share on 2024-01-16, holding 25M after.
Filings
30 · Latest SEC filingsTranscripts
Earnings callsFY2027 Q22026-11-10
Earnings calls
AI summary
positiveVodafone CEO Margherita Della Valle said the company made a strong start to its new growth chapter, with group service revenue growth accelerating to 6.4% in Q2, the highest in three years, and adjusted EBITDAaL growth accelerating to 6.4% in the first half. Vodafone Business posted its best-ever growth at 6.6%, and Africa and Turkiye both reported double-digit organic growth. The company upgraded FY2027 guidance, with the midpoint implying about 7% organic growth in adjusted EBITDAaL and just above 20% in adjusted free cash flow. The cost program announced in May delivered over EUR 200 million of gross savings in the first half, supported by 3,000 role reductions and EUR 50 million of U.K. synergies. In Germany, the company announced 2,300 further role reductions and took a noncash impairment, driven largely by higher German government bond yields and the discount rate rising to 8%, plus the impact of an ECJ ruling. The European outlook was reconfirmed despite a EUR 100 million EBITDA impact from the ECJ ruling.
Key takeaways
- Group service revenue growth accelerated to 6.4% in Q2, the highest in three years, with growth in both Europe and Africa.
- Adjusted EBITDAaL growth accelerated to 6.4% in the first half; Vodafone Business grew 6.6%, its best ever.
- The company upgraded FY2027 guidance; the midpoint implies roughly 7% organic adjusted EBITDAaL growth and about 21% adjusted free cash flow growth.
- The cost program delivered over EUR 200 million of gross savings in the first half, with a clear line of sight to over EUR 200 million of net OpEx reduction for the full year.
- In Germany, 2,300 further role reductions were announced, taking total headcount reduction there to 40% since the transformation began.
Financial highlights
- Group service revenue growth was 6.4% in Q2, the highest in three years.
- First-half adjusted EBITDAaL growth was 6.4%.
- Vodafone Business grew 6.6%, the best ever, with the digital services portfolio exceeding EUR 2 billion in revenue.
- First-half gross cost savings exceeded EUR 200 million, including 3,000 role reductions and EUR 50 million of U.K. synergies.
Guidance
- FY2027 guidance was upgraded; the midpoint implies about 7% organic growth in adjusted EBITDAaL and just above 20% in adjusted free cash flow.
- The European outlook was reconfirmed, absorbing a EUR 100 million EBITDA impact from the ECJ ruling.
- The company expects over EUR 200 million of net OpEx reduction this fiscal year, about a quarter of the over EUR 1 billion net target.
- The ECJ class-action provision is not included in this year's cash flow guidance; the process is expected to run well into 2027.
Q&A themes
- Where the guidance upgrade optimism comes from and the wide implied range for second-half European EBITDAaL.
- Germany turnaround: MDU competition, B2B and digital services growth, and the noncash impairment.
- Confidence in and potential scope of the cost-efficiency program, including AI and restructuring costs.
- Germany CapEx and network-sharing options, OXG equity funding with new partner SocGen, and the Safaricom stake legal challenge.
Risks
- Germany remains a drag: first-half EBITDAaL fell 3.2%, with the ECJ provision accounting for about 2 percentage points.
- Cost savings face headwinds from inflation in payroll, energy and tower leases.
- The Kenya High Court declared the 15% Safaricom stake sale void; the appeal is pending with status quo maintained, and the Vega share transfer still awaits regulatory approval.
Company news
Reuters, WSJ, Bloomberg and FT first, as far as our news provider delivers them; other publishers behind the second filter. Headlines link to the publisher.- Vodafone Dials Up Guidance But Says German Unit Needs Improvement
- Vodafone raises free cash flow forecast after strong first half
- Vodafone Deutschland to axe 2,300 jobs as it steps up cost-cutting efforts
- Vodafone Raises Savings Target for U.K. Unit
- Europe's biggest mobile operators in talks for satellite-to-mobile venture, Bloomberg News reports
Company data
Company intelligence
Updated: Nov 15, 2026, 02:11 PM UTC
Company data
Company intelligence
Company profile
- Sector
- Communication Services
- Industry
- Telecommunications Services
- Chief executive
- Margherita Della Valle
- Employees
- 91,128
- IPO date
- Nov 2, 1988
- Country
- GB
- Exchange
- NASDAQ Global Select
Rating factors
- Return on equityi
- 1/5
- Return on assetsi
- 1/5
- Debt to equityi
- 2/5
- Price to earningsi
- 1/5
- Price to booki
- 4/5
Company press releases
Congressional disclosures
Senate
House
Market cap history
Largest fund holders
| Fund | Weight | Shares held |
|---|---|---|
| VUKE.S | 0.73% | 48M |
| QDVX.F | 2.3% | 17.1M |
| VECA.S | 0.18% | 10M |
| VEUR.S | 0.17% | 9.6M |
| VCPA.S | 0.16% | 7.3M |
| AFTY | 3.5% | 6M |
| AVDE | 0.24% | 3M |
| QINTQINTQINT | 0.85% | 2.9M |
| VEVE.S | 0.03% | 2.3M |
| GMIE | 2.4% | 2.2M |
| IDVO | 2.49% | 2.2M |
| JHMD | 0.28% | 1.8M |
Analyst track record
How the analysts covering VOD have done: ratings, price-target accuracy and the measured reaction after their calls.
| 12 months | 3 years | |
|---|---|---|
| Ratings | 6 | 16 |
| Analysts | 5 | 9 |
| Buy / hold / sell | 4 / 1 / 1 | 8 / 6 / 2 |
| Upgrades / downgrades / initiations | 3 / 1 / 1 | 4 / 4 / 1 |
| Price targets hit / missed | 1 / 3 (25%) | 7 / 3 (70%) |
| Avg. return after a rating (TipRanks) | -25.1% | +83.9% |
| Best / worst call | +32.7% / -89.6% | +750.2% / -89.6% |
After buy calls on this stock: not enough measured cases yet
Latest ratings
| Date | Analyst | Call | Target | |
|---|---|---|---|---|
| Oct 1, 2026 | Paul SidneyBerenberg BankOct 1, 2026 | BuyInitiated | $18.50↗ | article ↗ |
| Sep 4, 2026 | Andrew LeeGoldman SachsSep 4, 2026 | BuyUpgraded | –↗ | article ↗ |
| Sep 4, 2026 | Unknown AnalystGoldman SachsSep 4, 2026 | BuyUpgraded | $20.93 | |
| Jul 10, 2026 | Alastair JonesNew StreetJul 10, 2026 | BuyUpgraded | –↗ | article ↗ |
| Jun 11, 2026 | Maurice PatrickBarclaysJun 11, 2026 | HoldDowngraded | $147↗ | article ↗ |
Share of analysts per call each month (latest call per analyst within 180 days). Targets and closes in USD.
TipRanks data · computed Nov 14, 2026 · 6 ratings
Frequently asked questions
Where can I trade VOD perpetual futures?
Vodafone Group Public Limited Company (VOD) perpetual futures trade on one crypto venue: Helix (Injective). PerpEquities shows its live price, funding rate, open interest and liquidity.
Can I trade VOD around the clock?
Yes. Unlike the underlying stock, VOD perpetuals trade 24/7 — including weekends and outside regular market hours.
What is the funding rate on VOD perpetuals?
Right now the VOD perp funding rate is +3.6% annualized (one venue). A positive rate means longs pay shorts. PerpEquities shows the live rate and its history.
How does the VOD perp price compare to the Vodafone Group Public Limited Company stock?
The venue-median VOD perp mark is $15.4 versus a reference stock price of $15.4, a basis of 0.0%. Perps follow the stock through an index price; the gap widens when funding or liquidity diverge between venues.
What is a VOD perpetual future?
A VOD perpetual is a derivative that tracks the price of Vodafone Group Public Limited Company with no expiry date. It lets you take long or short exposure to Vodafone Group Public Limited Company on crypto venues, around the clock.
What is VODUSDT perpetual?
VODUSDT is the symbol most crypto exchanges use for the Vodafone Group Public Limited Company perpetual settled in USDT (Tether). It tracks the VOD share price through an index, trades 24/7 with leverage and never expires.
Embed this asset
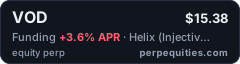
<a href="https://perpequities.com/stocks/vod-perp"><img src="https://perpequities.com/badge/vod-perp.svg" width="240" height="64" alt="VOD perpetuals · perpequities.com" loading="lazy"></a>