
Equity
Shin-Etsu Chemical Co., Ltd. (SHINETSU) perpetual futures
SHINETSU perpetual futures on 1 crypto exchanges – live perp price vs the stock, funding rate, open interest and where to trade SHINETSUUSDT.
Shin-Etsu Chemical provides infrastructure, electronics, and functional materials, including PVC resins, semiconductor silicon, photoresists, silicones, and rare earth magnets.
Price chart
Use the left and right arrow keys to inspect points on the chart.
Trading data
Perpetual market activity
1/1 live markets
Trading data
Perpetual market activity
Spot performance
 MEXC
Tradability
Execution quality
Entry cost and depth per venue at $1k–$100k
Tradability
Execution quality
Entry cost and depth per venue at $1k–$100kNo sufficient depth · 0 of 1 venues absorb $10k
Too thin: MEXC
Taker execution estimate incl. approx. fees - maker fills are not guaranteed.
Best venues for this underlying
Best liquidity
SHINETSUTightest spread
SHINETSUHighest volume
SHINETSUFunding history
Stored venue snapshots by market
Funding history
Stored venue snapshots by marketNext catalyst
Catalysts
Next catalyst
Catalysts
No unusual perp activity right now.
Research data
Analysts, filings and peer context
Research data
Analysts, filings and peer context
Estimates
6Company events
6Peer comparison
Similar listed perpsAnalysts
PendingOwnership
SHINETSU-PERPCompany news
Reuters, WSJ, Bloomberg and FT first, as far as our news provider delivers them; other publishers behind the second filter. Headlines link to the publisher.No articles from Reuters, WSJ, Bloomberg or FT for this company in our feed.
Company data
Company intelligence
Updated: Nov 2, 2026, 04:04 PM UTC
Company data
Company intelligence
Company profile
- Sector
- Basic Materials
- Industry
- Chemicals
- Chief executive
- Yasuhiko Saitoh
- Employees
- 27,852
- IPO date
- May 15, 1949
- Country
- JP
- Exchange
- Tokyo Stock Exchange
Rating factors
- Return on equityi
- 4
- Return on assetsi
- 5
- Debt to equityi
- 3
- Price to earningsi
- 2
- Price to booki
- 2
Market cap history
Largest fund holders
| Fund | Weight | Shares held |
|---|---|---|
| 1306.T | 0.91% | 53.9M |
| 1321.T | 1.48% | 44.4M |
| VXUS | 0.15% | 26.6M |
| 1330.T | 1.58% | 22.6M |
| VEA | 0.21% | 17.6M |
| IEFA | 0.25% | 12.5M |
| EWJ | 1.2% | 7.5M |
| INJ | 1.54% | 7M |
| FSPSX | 0.29% | 6.5M |
| BBJP | 1.29% | 6.4M |
| IEE | 0.37% | 5.9M |
| EFA | 0.29% | 5.9M |
Analyst track record
How the analysts covering SHINETSU have done: ratings, price-target accuracy and the measured reaction after their calls.
| 12 months | 3 years | |
|---|---|---|
| Ratings | 0 | 0 |
| Analysts | 0 | 0 |
| Buy / hold / sell | – | – |
| Upgrades / downgrades / initiations | 0 / 0 / 0 | 0 / 0 / 0 |
| Price targets hit / missed | – | – |
| Avg. return after a rating (TipRanks) | – | – |
| Best / worst call | – / – | – / – |
After buy calls on this stock: not enough measured cases yet
TipRanks data · computed Nov 4, 2026 · 0 ratings
Frequently asked questions
Where can I trade SHINETSU perpetual futures?
Shin-Etsu Chemical Co., Ltd. (SHINETSU) perpetual futures trade on 1 crypto venues, including MEXC. PerpEquities compares them by live price, funding rate, open interest and liquidity.
Can I trade SHINETSU around the clock?
Yes. Unlike the underlying stock, SHINETSU perpetuals trade 24/7 — including weekends and outside regular market hours.
What is the funding rate on SHINETSU perpetuals?
Right now the SHINETSU perp funding rate is -13.4% annualized (venue median), ranging from -13.4% to -13.4% across 1 venues. A positive rate means longs pay shorts. PerpEquities shows the live rate and its history for every venue.
How does the SHINETSU perp price compare to the Shin-Etsu Chemical Co., Ltd. stock?
The venue-median SHINETSU perp mark is $33.6 versus a reference stock price of $33.6, a basis of 0.0%. Perps follow the stock through an index price; the gap widens when funding or liquidity diverge between venues.
What is a SHINETSU perpetual future?
A SHINETSU perpetual is a derivative that tracks the price of Shin-Etsu Chemical Co., Ltd. with no expiry date. It lets you take long or short exposure to Shin-Etsu Chemical Co., Ltd. on crypto venues, around the clock.
What is SHINETSUUSDT perpetual?
SHINETSUUSDT is the symbol most crypto exchanges use for the Shin-Etsu Chemical Co., Ltd. perpetual settled in USDT (Tether). It tracks the SHINETSU share price through an index, trades 24/7 with leverage and never expires.
Embed this asset

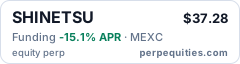
<a href="https://perpequities.com/stocks/shinetsu-perp"><img src="https://perpequities.com/badge/shinetsu-perp.svg" width="240" height="64" alt="SHINETSU perpetuals · perpequities.com" loading="lazy"></a>