
Equity · Technology
Onto Innovation Inc. (ONTO) perpetual futures
ONTO perpetual futures on 1 crypto exchange – live perp price vs the stock, funding rate, open interest and where to trade ONTOUSDT.
Onto Innovation designs, manufactures and supports process control solutions, including macro defect inspection, 2D/3D optical metrology, lithography systems and analytical software for semiconductor and advanced packaging manufacturers.
Price chart
Use the left and right arrow keys to inspect points on the chart.
Trading data
Perpetual market activity
1/1 live markets
Trading data
Perpetual market activity
Spot performance
Venue matrix
1 markets
Some venue links are sponsored. We may receive a commission, and eligible users may occasionally receive trading-fee discounts, at no additional cost to you.
| Trade | ||||||||||||
|---|---|---|---|---|---|---|---|---|---|---|---|---|
 Helix (Injective) | Trade | ONTO/USDC | Trading | $204.83 | +3.6% APR +0.00042% every 1h | - | $0 | $3.4K | - | USDC | 12x |
Tradability
Execution quality
Entry cost and depth per venue at $1k–$100k
Tradability
Execution quality
Entry cost and depth per venue at $1k–$100kNo sufficient depth · 0 of 1 venues absorb $10k
No fresh book data: Helix (Injective)
Taker execution estimate incl. approx. fees - maker fills are not guaranteed.
Best venues for this underlying
Best liquidity
ONTOTightest spread
-Highest volume
ONTOFunding history
Stored venue snapshots by market
Funding history
Stored venue snapshots by marketNext catalyst
Catalysts
Next catalyst
Catalysts
No unusual perp activity right now.
Research data
Analysts, filings and peer context
Research data
Analysts, filings and peer context
Estimates
6Company events
6Peer comparison
Similar listed perpsRevenue mix
Latest annualAnalysts
Price targets in USD| Consensus rating | Buy |
|---|---|
| Average 12-month price target | $371.82 |
| 12-month target range (low – high) | $285 – $450 |
| Ratings in the provider's consensus | 14 |
Price targets as of 2026-11-15
Analyst rating history
Ratings| Month | Strong buy | Buy | Hold | Sell | Strong sell |
|---|---|---|---|---|---|
| Nov 2026 | 3 | 9 | 0 | 0 | 0 |
| Oct 2026 | 3 | 9 | 0 | 0 | 0 |
| Sep 2026 | 2 | 9 | 0 | 0 | 0 |
| Aug 2026 | 2 | 9 | 0 | 0 | 0 |
| Jul 2026 | 2 | 8 | 0 | 0 | 0 |
| Jun 2026 | 2 | 8 | 0 | 0 | 0 |
| May 2026 | 1 | 6 | 0 | 0 | 0 |
| Apr 2026 | 1 | 6 | 1 | 0 | 0 |
| Mar 2026 | 1 | 5 | 1 | 0 | 0 |
| Feb 2026 | 1 | 5 | 2 | 0 | 0 |
| Jan 2026 | 1 | 5 | 2 | 0 | 0 |
| Dec 2025 | 1 | 5 | 2 | 0 | 0 |
Ownership
Institutional · 2026-Q3Reference market activity
ONTO-PERPPrice performance
11Insider activity
FY2026 Q3Insider transactions
25Director David Brian Miller sold 2,000 common shares of Onto Innovation at $300 on Sept 29, 2026, leaving 10,692 shares owned.
Onto Innovation CFO Brian K. Roberts disposed of 3,239 common shares at $254.55 via tax withholding (code F), not an open-market sale, leaving 21,032 shares owned.
Onto Innovation officer Chen Shirley reported 1,516 common shares withheld for taxes at $254.55 per share, leaving 14,001 shares owned.
Onto Innovation CFO Brian K. Roberts reported a Form 4/A disclosing the withholding of 3,239 common shares at $254.55 each to cover taxes, leaving 21,032 shares owned.
Director Susan D Lynch sold 1,000 Onto Innovation common shares on the open market at $302.30 on 2026-08-21, leaving 2,684 shares owned.
Director Su May received an award of 761 shares of Onto Innovation common stock on 2026-05-20, held at $0.00 as compensation rather than a purchase, leaving 7,984 shares owned.
Director Christopher A. Seams received an A-Award grant of 761 Onto Innovation common shares on 2026-05-20, bringing his holdings to 38,513 shares.
Director Stephen S Schwartz received 761 shares of Onto Innovation common stock as an award (A) on 2026-05-20, at a reported $0.00 price. He held 3,536 shares afterward.
Director David Brian Miller received an award of 761 shares of Onto Innovation common stock on May 20, 2026, at $0.00 per share, bringing his holdings to 12,692 shares.
Director Susan D Lynch received an award of 761 shares of Onto Innovation common stock on 2026-05-20, a grant rather than an open-market purchase. She held 3,684 shares afterward.
Director Stephen Douglas Kelley received an A-Award of 761 shares of Onto Innovation (ONTO) common stock at $0.00 on 2026-05-20, leaving 6,384 shares owned.
Onto Innovation COO Ramile Yaldaei had 843 common shares withheld at $271.77 on May 15, 2026 to cover taxes (F-Tax), leaving 17,593 shares owned.
Onto Innovation officer Oh Yoon Ah (SVP, Gen Counsel & Corp Sec) reported 530 common shares withheld for taxes at $271.77 per share on 2026-05-15, leaving 21,110 shares owned.
Onto Innovation CFO Brian K. Roberts was granted 3,096 common shares and 1,548 performance stock units on 2026-03-02, both as compensation awards at $0.00. He held 24,271 common shares after.
Onto Innovation officer Ido Dolev received a grant of 3,440 common shares and 1,720 performance stock units, and 819 shares were withheld for tax at $207.50.
Onto Innovation COO Ramile Yaldaei received awards of 7,683 common shares and 1,548 performance stock units on March 2, 2026, and had 615 shares withheld for taxes at $207.50 on March 3; he held 18,436 common shares afterward.
Onto Innovation CEO Michael Plisinski received awards of 14,479 common shares and 7,239 performance stock units, and had 3,742 shares withheld for taxes at $207.50. He held 179,242 shares afterward.
Filings
30 · Latest SEC filingsDirector David Brian Miller sold 2,000 common shares of Onto Innovation at $300 on Sept 29, 2026, leaving 10,692 shares owned.
Onto Innovation CFO Brian K. Roberts disposed of 3,239 common shares at $254.55 via tax withholding (code F), not an open-market sale, leaving 21,032 shares owned.
Onto Innovation officer Chen Shirley reported 1,516 common shares withheld for taxes at $254.55 per share, leaving 14,001 shares owned.
Onto Innovation CFO Brian K. Roberts reported a Form 4/A disclosing the withholding of 3,239 common shares at $254.55 each to cover taxes, leaving 21,032 shares owned.
Director Susan D Lynch sold 1,000 Onto Innovation common shares on the open market at $302.30 on 2026-08-21, leaving 2,684 shares owned.
Director Su May received an award of 761 shares of Onto Innovation common stock on 2026-05-20, held at $0.00 as compensation rather than a purchase, leaving 7,984 shares owned.
Director Christopher A. Seams received an A-Award grant of 761 Onto Innovation common shares on 2026-05-20, bringing his holdings to 38,513 shares.
Director Stephen S Schwartz received 761 shares of Onto Innovation common stock as an award (A) on 2026-05-20, at a reported $0.00 price. He held 3,536 shares afterward.
Director David Brian Miller received an award of 761 shares of Onto Innovation common stock on May 20, 2026, at $0.00 per share, bringing his holdings to 12,692 shares.
Director Susan D Lynch received an award of 761 shares of Onto Innovation common stock on 2026-05-20, a grant rather than an open-market purchase. She held 3,684 shares afterward.
Director Stephen Douglas Kelley received an A-Award of 761 shares of Onto Innovation (ONTO) common stock at $0.00 on 2026-05-20, leaving 6,384 shares owned.
Onto Innovation COO Ramile Yaldaei had 843 common shares withheld at $271.77 on May 15, 2026 to cover taxes (F-Tax), leaving 17,593 shares owned.
Onto Innovation officer Oh Yoon Ah (SVP, Gen Counsel & Corp Sec) reported 530 common shares withheld for taxes at $271.77 per share on 2026-05-15, leaving 21,110 shares owned.
Transcripts
Earnings callsFY2026 Q32026-11-09
Earnings calls
AI summary
positiveOnto Innovation reported Q3 revenue of $410 million, up 19% sequentially and nearly 90% year-over-year, with gross margin of 57.6% and operating margin of 32.6%, all above the high end of guidance. Earnings were $2.44 per share, up 26% from Q2. Advanced packaging and specialty devices grew 35% sequentially and comprised a little over half of revenue; advanced nodes delivered approximately $135 million, about 60% memory and 40% logic. Backlog rose 20% to more than $1.3 billion. For Q4, the company guides revenue of $430 million to $450 million, gross margin slightly above 58% (an additional 0.5 percentage point), operating margin of 34% and EPS of $2.69 at the midpoint. Full-year revenue is expected to be a record $1.485 billion at the midpoint, more than 45% growth. Management expects sequential revenue growth through at least the first half of 2027, with advanced packaging revenue growth exceeding 80% in 2026 and advanced nodes over 35%.
Key takeaways
- Q3 revenue, operating margin and EPS all surpassed the high end of guidance; gross margin improved 60 basis points sequentially to 57.6%
- Backlog increased 20% to more than $1.3 billion, which management cited as providing visibility into 2027 and in some cases 2028 and beyond
- Advanced packaging and specialty devices grew 35% sequentially and made up a little over half of Q3 revenue; advanced packaging remains on track to grow over 80% in 2026
- Dragonfly G5 revenue has expanded to more than 10 customers since its launch this year, with 2027 purchase orders already representing a doubling of 2026 G5 revenue
- Atlas G6 had the fastest OCD platform launch in company history; OCD is shifting toward in-die metrology, raising capital intensity
Financial highlights
- Q3 revenue was $410 million, up 19% sequentially and nearly 90% year-over-year
- Q3 gross margin was 57.6%, up 60 basis points sequentially and 300 basis points versus Q4 2025; operating margin was 32.6%, up 260 basis points sequentially
- Q3 advanced node revenue was approximately $135 million (about 60% memory, 40% logic); software and services made up the remaining $60 million
- Q3 EPS was $2.44, up 26% from Q2; cash and short-term investments were approximately $1.25 billion as of September 30, including about $80 million of free cash flow in the quarter
Guidance
- Q4 revenue guidance is $430 million to $450 million, an increase of over 7% sequentially at the midpoint
- Q4 gross margin expected to rise an additional 0.5 percentage point to slightly above 58%; Q4 operating margin expected at 34% at the midpoint
- Q4 EPS expected at $2.69 at the midpoint, assuming a non-GAAP tax rate of approximately 16% and about 50 million shares outstanding
- Full-year 2026 revenue on pace for a record $1.485 billion at the midpoint, with record top-line growth of over 45%; the company expects sequential revenue growth through at least the first half of 2027
Q&A themes
- Visibility and backlog composition: backlog growth described as fairly balanced between advanced nodes and advanced packaging, driven by customers planning ahead to secure tools for their ramps
- Gross margin trajectory: management pointed to roughly 50 basis points per quarter of improvement as a realistic way to think about 2027, citing the extended factory model and supply chain localization; component and memory cost headwinds were acknowledged
- Advanced packaging technology transitions (CoWoS, EMIB, panel, hybrid bonding): management said process control intensity continues to increase and it is well positioned across the packaging value chain
- HBM and Dragonfly G5 dynamics: HBM4/4E shifts framed as a wafer-volume question; G5 growth described as coming from new high-resolution applications rather than G3 replacement
Risks
- Supply chain pricing pressures, including memory component costs, were acknowledged; management said design changes are being made to reduce memory usage
- NAND was described as less significant and less certain for 2027 growth than DRAM and logic
- Front-end inspection evaluations of Dragonfly G5 are progressing but are not expected to contribute revenue this year; management expects deals to potentially close next year
Company news
Reuters, WSJ, Bloomberg and FT first, as far as our news provider delivers them; other publishers behind the second filter. Headlines link to the publisher.No articles from Reuters, WSJ, Bloomberg or FT for this company in our feed.
Company data
Company intelligence
Updated: Nov 15, 2026, 02:11 PM UTC
Company data
Company intelligence
Company profile
- Sector
- Technology
- Industry
- Semiconductors
- Chief executive
- Michael Plisinski
- Employees
- 1,867
- IPO date
- Oct 28, 2019
- Country
- US
- Exchange
- New York Stock Exchange
Rating factors
- Return on equityi
- 3/5
- Return on assetsi
- 3/5
- Debt to equityi
- 1/5
- Price to earningsi
- 1/5
- Price to booki
- 1/5
Company press releases
Congressional disclosures
Market cap history
Largest fund holders
| Fund | Weight | Shares held |
|---|---|---|
| BALPX | 0.32% | 12.4M |
| AIO | 1% | 9.6M |
| IJH | 0.3% | 1.8M |
| XAW.TO | 0.01% | 1.8M |
| NJH | 0.41% | 1.7M |
| VTI | 0.02% | 1.6M |
| VB | 0.19% | 1.1M |
| VBK | 0.43% | 614.3K |
| VGT | 0.1% | 556.7K |
| VXF | 0.18% | 552.6K |
| BAI | 0.93% | 528.1K |
| VEXPX | 0.6% | 431.9K |
Analyst track record
How the analysts covering ONTO have done: ratings, price-target accuracy and the measured reaction after their calls.
| 12 months | 3 years | |
|---|---|---|
| Ratings | 72 | 154 |
| Analysts | 14 | 17 |
| Buy / hold / sell | 68 / 4 / 0 | 136 / 18 / 0 |
| Upgrades / downgrades / initiations | 3 / 0 / 6 | 7 / 3 / 10 |
| Price targets hit / missed | 8 / 64 (11%) | 53 / 95 (36%) |
| Avg. return after a rating (TipRanks) | -32.3% | -8.3% |
| Best / worst call | +35.8% / -54.8% | +126.2% / -54.8% |
After buy calls on this stock: not enough measured cases yet
Latest ratings
| Date | Analyst | Call | Target | |
|---|---|---|---|---|
| Nov 11, 2026 | Nazerke BaimukanFreedom Capital MarketsNov 11, 2026 | BuyMaintained | $325↗ | article ↗ |
| Nov 11, 2026 | Shane Brett CFAMorgan StanleyNov 11, 2026 | BuyReiterated | $325↗ | article ↗ |
| Nov 10, 2026 | Blayne CurtisJefferiesNov 10, 2026 | BuyMaintained | $350↗ | article ↗ |
| Nov 10, 2026 | Brian ChinStifel NicolausNov 10, 2026 | BuyMaintained | $305↗ | article ↗ |
| Nov 10, 2026 | Vedvati ShrotreEvercore ISINov 10, 2026 | BuyMaintained | $250↗ | article ↗ |
Share of analysts per call each month (latest call per analyst within 180 days). Targets and closes in USD.
TipRanks data · computed Nov 14, 2026 · 72 ratings
Frequently asked questions
Where can I trade ONTO perpetual futures?
Onto Innovation Inc. (ONTO) perpetual futures trade on one crypto venue: Helix (Injective). PerpEquities shows its live price, funding rate, open interest and liquidity.
Can I trade ONTO around the clock?
Yes. Unlike the underlying stock, ONTO perpetuals trade 24/7 — including weekends and outside regular market hours.
What is the funding rate on ONTO perpetuals?
Right now the ONTO perp funding rate is +3.6% annualized (one venue). A positive rate means longs pay shorts. PerpEquities shows the live rate and its history.
How does the ONTO perp price compare to the Onto Innovation Inc. stock?
The venue-median ONTO perp mark is $204.8 versus a reference stock price of $204.8, a basis of 0.0%. Perps follow the stock through an index price; the gap widens when funding or liquidity diverge between venues.
What is a ONTO perpetual future?
A ONTO perpetual is a derivative that tracks the price of Onto Innovation Inc. with no expiry date. It lets you take long or short exposure to Onto Innovation Inc. on crypto venues, around the clock.
What is ONTOUSDT perpetual?
ONTOUSDT is the symbol most crypto exchanges use for the Onto Innovation Inc. perpetual settled in USDT (Tether). It tracks the ONTO share price through an index, trades 24/7 with leverage and never expires.
Embed this asset
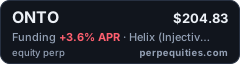
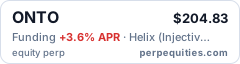
<a href="https://perpequities.com/stocks/onto-perp"><img src="https://perpequities.com/badge/onto-perp.svg" width="240" height="64" alt="ONTO perpetuals · perpequities.com" loading="lazy"></a>