
Equity
Realty Income Corporation (O) perpetual futures
O perpetual futures on 1 crypto exchange – live perp price vs the stock, funding rate, open interest and where to trade OUSDT.
Realty Income Corporation is a US REIT that owns over 6,500 commercial properties leased to businesses under long-term contracts, generating monthly dividend income for shareholders.
Price chart
Use the left and right arrow keys to inspect points on the chart.
Trading data
Perpetual market activity
1/1 live markets
Trading data
Perpetual market activity
Spot performance
Venue matrix
1 markets
Some venue links are sponsored. We may receive a commission, and eligible users may occasionally receive trading-fee discounts, at no additional cost to you.
| Trade | ||||||||||||
|---|---|---|---|---|---|---|---|---|---|---|---|---|
 Helix (Injective) | Trade | O/USDC | Trading | $58.84 | +3.6% APR +0.00042% every 1h | - | $0 | - | - | USDC | 12x |
Tradability
Execution quality
Entry cost and depth per venue at $1k–$100k
Tradability
Execution quality
Entry cost and depth per venue at $1k–$100kNo sufficient depth · 0 of 1 venues absorb $10k
No fresh book data: Helix (Injective)
Taker execution estimate incl. approx. fees - maker fills are not guaranteed.
Best venues for this underlying
Best liquidity
OTightest spread
-Highest volume
-Funding history
Stored venue snapshots by market
Funding history
Stored venue snapshots by marketNext catalyst
Catalysts
Next catalyst
Catalysts
No unusual perp activity right now.
Research data
Analysts, filings and peer context
Research data
Analysts, filings and peer context
Estimates
6Company events
6Peer comparison
Similar listed perpsRevenue mix
Latest annualAnalysts
Price targets in USD| Consensus rating | Hold |
|---|---|
| Average 12-month price target | $75.58 |
| 12-month target range (low – high) | $59 – $187 |
| Ratings in the provider's consensus | 35 |
Price targets as of 2026-11-15
Analyst rating history
Ratings| Month | Strong buy | Buy | Hold | Sell | Strong sell |
|---|---|---|---|---|---|
| Nov 2026 | 2 | 6 | 17 | 0 | 1 |
| Oct 2026 | 2 | 6 | 17 | 0 | 1 |
| Sep 2026 | 3 | 6 | 16 | 0 | 1 |
| Aug 2026 | 3 | 5 | 15 | 0 | 1 |
| Jul 2026 | 3 | 5 | 15 | 0 | 1 |
| Jun 2026 | 3 | 5 | 15 | 0 | 1 |
| May 2026 | 3 | 5 | 16 | 0 | 1 |
| Apr 2026 | 3 | 4 | 16 | 0 | 1 |
| Mar 2026 | 3 | 5 | 16 | 0 | 1 |
| Feb 2026 | 3 | 6 | 15 | 0 | 1 |
| Jan 2026 | 2 | 6 | 18 | 0 | 1 |
| Dec 2025 | 1 | 5 | 19 | 0 | 1 |
Ownership
Institutional · 2026-Q3Reference market activity
O-PERPPrice performance
11Insider activity
FY2026 Q3Insider transactions
25Director Gregory McLaughlin sold 3,475 shares of Realty Income common stock on the open market at $60.1502 per share on 2026-09-10, leaving 34,732 shares directly owned.
Redington Neale reported a Form 4 with the SEC: 240 shares of Realty Income common stock were withheld for taxes at $63.12 per share, leaving 23,618 shares owned.
Director Gregory McLaughlin received an A-Award of 3,214 common shares of Realty Income at $0.00 on 2026-05-21, leaving him with 38,207 shares directly owned. This is a compensation grant, not an open-market purchase.
Director Michael D. McKee received an award (code A) of 3,214 common shares of Realty Income at $0.00 on 2026-05-21, bringing his holdings to 144,046 shares.
Realty Income director Gerardo I. Lopez received an award of 3,214 common shares at $0.00 on May 21, 2026, bringing his holdings to 34,846 shares.
Director Jeff A Jacobson received a grant (A-Award) of 3,214 shares of Realty Income common stock on 2026-05-21, after which he held 14,846 shares. A grant at $0.00 is compensation, not a purchase.
Director Priya Cherian Huskins received a grant of 3,214 common shares of Realty Income at $0.00 on 2026-05-21, raising her holdings to 54,246 shares (Form 4 filed 2026-05-26).
Director Mary Hogan Preusse received a 3,214-share Common Stock award (A code, not an open-market purchase) on 2026-05-21, raising her direct holding to 22,425 shares.
Director Kimberly Hourihan received a 3,214-share Common Stock award (code A) on 2026-05-21 at $0.00, lifting her holdings to 6,613 shares. This is a compensation grant, not an open-market purchase.
Director Reginald Harold Gilyard received a grant of 3,214 shares of Realty Income common stock at $0.00 (A-Award), bringing his holdings to 10,847 shares.
Director A. Larry Chapman received an award of 3,214 Realty Income common shares on 2026-05-21 (A-Award, $0.00), raising his holding to 12,103 shares.
Director Priscilla Almodovar received a 3,214-share award of Realty Income common stock on 2026-05-21 at $0.00 (Form 4, filed 2026-05-26), leaving 25,179 shares owned. This is a grant, not an open-market purchase.
Officer Bushore Michelle reported an open-market sale (S) of 7,400 Realty Income common shares at $62.42 on 2026-04-02, leaving 67,641 shares owned.
Director Gregory McLaughlin sold 3,275 shares of Realty Income common stock on April 1, 2026, at $61.87 per share, leaving 34,993 shares owned.
On 2026-02-26, officer Bushore Michelle received a 7,698-share Common Stock award (code A) at $0.00, leaving 75,041 shares owned. Form 4 filed 2026-03-05.
Realty Income officer Whyte Gregory J. received 29,630 common shares in two A-Award grants and had 6,114 shares withheld for taxes (F-InKind) at $66.49, leaving 27,945 shares owned.
CEO Roy Sumit received 137,639 common shares as awards and had 28,002 shares withheld for taxes at $66.49, leaving 424,300 shares owned.
Officer Neale Redington received an award (A) of 10,753 shares of Realty Income common stock on Feb 17, 2026, at $0.00 per share, raising holdings to 23,858 shares.
Realty Income officer Jonathan Pong (EVP, CFO) was awarded 7,110 shares of common stock on Feb 17, 2026, an award rather than an open-market purchase, leaving him with 43,291 shares.
Officer Kehle Shannon received 2 grants (A-Awards) totaling 7,128 shares of Realty Income Common Stock at $0.00 on 2026-02-17. These are compensation grants, not open-market purchases.
Filings
30 · Latest SEC filingsDirector Gregory McLaughlin sold 3,475 shares of Realty Income common stock on the open market at $60.1502 per share on 2026-09-10, leaving 34,732 shares directly owned.
Redington Neale reported a Form 4 with the SEC: 240 shares of Realty Income common stock were withheld for taxes at $63.12 per share, leaving 23,618 shares owned.
Director Gregory McLaughlin received an A-Award of 3,214 common shares of Realty Income at $0.00 on 2026-05-21, leaving him with 38,207 shares directly owned. This is a compensation grant, not an open-market purchase.
Director Michael D. McKee received an award (code A) of 3,214 common shares of Realty Income at $0.00 on 2026-05-21, bringing his holdings to 144,046 shares.
Realty Income director Gerardo I. Lopez received an award of 3,214 common shares at $0.00 on May 21, 2026, bringing his holdings to 34,846 shares.
Director Jeff A Jacobson received a grant (A-Award) of 3,214 shares of Realty Income common stock on 2026-05-21, after which he held 14,846 shares. A grant at $0.00 is compensation, not a purchase.
Director Priya Cherian Huskins received a grant of 3,214 common shares of Realty Income at $0.00 on 2026-05-21, raising her holdings to 54,246 shares (Form 4 filed 2026-05-26).
Director Mary Hogan Preusse received a 3,214-share Common Stock award (A code, not an open-market purchase) on 2026-05-21, raising her direct holding to 22,425 shares.
Director Kimberly Hourihan received a 3,214-share Common Stock award (code A) on 2026-05-21 at $0.00, lifting her holdings to 6,613 shares. This is a compensation grant, not an open-market purchase.
Director Reginald Harold Gilyard received a grant of 3,214 shares of Realty Income common stock at $0.00 (A-Award), bringing his holdings to 10,847 shares.
Director A. Larry Chapman received an award of 3,214 Realty Income common shares on 2026-05-21 (A-Award, $0.00), raising his holding to 12,103 shares.
Director Priscilla Almodovar received a 3,214-share award of Realty Income common stock on 2026-05-21 at $0.00 (Form 4, filed 2026-05-26), leaving 25,179 shares owned. This is a grant, not an open-market purchase.
Transcripts
PendingCompany news
Reuters, WSJ, Bloomberg and FT first, as far as our news provider delivers them; other publishers behind the second filter. Headlines link to the publisher.No articles from Reuters, WSJ, Bloomberg or FT for this company in our feed.
Company data
Company intelligence
Updated: Nov 15, 2026, 02:11 PM UTC
Company data
Company intelligence
Company profile
- Sector
- Real Estate
- Industry
- REIT - Retail
- Chief executive
- Sumit Roy
- Employees
- 544
- IPO date
- Oct 18, 1994
- Country
- US
- Exchange
- New York Stock Exchange
Rating factors
- Return on equityi
- 3/5
- Return on assetsi
- 3/5
- Debt to equityi
- 3/5
- Price to earningsi
- 1/5
- Price to booki
- 2/5
Company press releases
Congressional disclosures
Senate
House
Market cap history
Largest fund holders
| Fund | Weight | Shares held |
|---|---|---|
| VNQ | 2.85% | 35M |
| VTI | 0.07% | 30M |
| VOO | 0.08% | 24.9M |
| VO | 0.51% | 20.3M |
| IVV | 0.09% | 12.7M |
| SPY | 0.09% | 11.6M |
| FXAIX | 0.08% | 11.3M |
| VTV | 0.19% | 9M |
| SDY | 2.25% | 8.6M |
| VCPA.S | 0.19% | 8.5M |
| SCHH | 3.93% | 7.9M |
| VOT | 1.21% | 7.4M |
Analyst track record
How the analysts covering O have done: ratings, price-target accuracy and the measured reaction after their calls.
| 12 months | 3 years | |
|---|---|---|
| Ratings | 83 | 230 |
| Analysts | 25 | 33 |
| Buy / hold / sell | 27 / 53 / 3 | 86 / 141 / 3 |
| Upgrades / downgrades / initiations | 3 / 3 / 2 | 6 / 6 / 12 |
| Price targets hit / missed | 0 / 78 (0%) | 27 / 187 (13%) |
| Avg. return after a rating (TipRanks) | -10.2% | -6.7% |
| Best / worst call | -0.3% / -18.3% | +8.9% / -18.3% |
After buy calls on this stock: not enough measured cases yet
Latest ratings
| Date | Analyst | Call | Target | |
|---|---|---|---|---|
| Nov 10, 2026 | Linda TsaiTruist FinancialNov 10, 2026 | HoldMaintained | $63.00↗ | article ↗ |
| Nov 9, 2026 | Jeffrey SpectorBank of America SecuritiesNov 9, 2026 | HoldMaintained | –↗ | article ↗ |
| Nov 5, 2026 | Richard AndersonCantor FitzgeraldNov 5, 2026 | HoldMaintained | $63.00↗ | article ↗ |
| Nov 4, 2026 | Zhiger KurmetFreedom Capital MarketsNov 4, 2026 | BuyMaintained | $63.00↗ | article ↗ |
| Nov 3, 2026 | Simon YarmakStifel NicolausNov 3, 2026 | BuyMaintained | $63.75↗ | article ↗ |
Share of analysts per call each month (latest call per analyst within 180 days). Targets and closes in USD.
TipRanks data · computed Nov 14, 2026 · 83 ratings
Frequently asked questions
Where can I trade O perpetual futures?
Realty Income Corporation (O) perpetual futures trade on one crypto venue: Helix (Injective). PerpEquities shows its live price, funding rate, open interest and liquidity.
Can I trade O around the clock?
Yes. Unlike the underlying stock, O perpetuals trade 24/7 — including weekends and outside regular market hours.
What is the funding rate on O perpetuals?
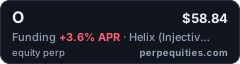
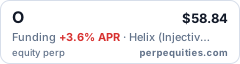
Right now the O perp funding rate is +3.6% annualized (one venue). A positive rate means longs pay shorts. PerpEquities shows the live rate and its history.
How does the O perp price compare to the Realty Income Corporation stock?
The venue-median O perp mark is $58.8 versus a reference stock price of $58.8, a basis of 0.0%. Perps follow the stock through an index price; the gap widens when funding or liquidity diverge between venues.
What is a O perpetual future?
A O perpetual is a derivative that tracks the price of Realty Income Corporation with no expiry date. It lets you take long or short exposure to Realty Income Corporation on crypto venues, around the clock.
What is OUSDT perpetual?
OUSDT is the symbol most crypto exchanges use for the Realty Income Corporation perpetual settled in USDT (Tether). It tracks the O share price through an index, trades 24/7 with leverage and never expires.
Embed this asset
<a href="https://perpequities.com/stocks/o-perp"><img src="https://perpequities.com/badge/o-perp.svg" width="240" height="64" alt="O perpetuals · perpequities.com" loading="lazy"></a>