
Akcja · Usługi komunalne
Kontrakty perpetual Constellation Energy Corporation (CEG)
Perpetual futures CEG na 3 giełdach krypto – cena perpa vs akcja, funding, open interest i gdzie handlować CEGUSDT.
Constellation Energy Corporation wytwarza i sprzedaje energię elektryczną, gaz ziemny i zrównoważone rozwiązania energetyczne na rynkach USA, w tym Mid-Atlantic i ERCOT, z portfolio obejmującym energię jądrową, wiatrową, słoneczną i wodną.
Wykres ceny
Użyj klawiszy strzałek w lewo i w prawo, aby przeglądać punkty na wykresie.
Dane handlowe
Aktywność rynku perpetual
3/4 aktywnych rynków
Dane handlowe
Aktywność rynku perpetual
Wyniki spot
Macierz giełd
4 rynków
Niektóre linki do platform są sponsorowane. Możemy otrzymać prowizję, a uprawnieni użytkownicy mogą czasami otrzymać zniżki na opłaty transakcyjne, bez dodatkowych kosztów.
| Handluj | ||||||||||||
|---|---|---|---|---|---|---|---|---|---|---|---|---|
 MEXC MEXC | Handluj | CEG/USDT | W obrocie | $268,84 | +21,9% APR +0,020% co 8h | +25,7 bps | 4,3 tys. $ | 97,5 tys. $ | 102,8 tys. $ | USDT | 20x | |
 Gate.io Gate.io | Handluj | CEG/USDT | W obrocie | $271,20 | 0,0% APR 0,000% co 8h | +169,6 bps | 387,6 $ | 2,3 tys. $ | 113,3 tys. $ | USDT | 20x | |
 Extended Extended | Handluj | CEG/USD | W obrocie | $268,82 | +4,4% APR +0,00050% co 1h | +630,1 bps | 0 $ | 0 $ | 1,1 tys. $ | USD | 5x | |
 BingX BingX | Handluj | CEG-USDT | Obserwowane | - | - | - | - | - | - | USDT | - |
Tokenizowane odpowiedniki prawdziwej akcji, handlowane całodobowo on-chain i na giełdach krypto. Premia/dyskonto porównuje cenę tokena z naszą ceną referencyjną akcji. Dane: CoinMarketCap · Robinhood · DexScreener · GeckoTerminal.
| Produkt | Kurs | Premia vs akcja | Wol. 24h | Kapitalizacja | Sieci |
|---|---|---|---|---|---|
| CEGRobinhood | $268,69 | -0,06% | $5k | $47k | Robinhood Chain |
| Giełda | Para | Kurs | Wol. 24h | Płynność |
|---|---|---|---|---|
 uniswapDEX · robinhood uniswapDEX · robinhood | CEG/USDG ↗ | $268,69 | $5k | $38k |
Płynność handlu
Jakość egzekucji
Koszt wejścia i głębokość na giełdę przy $1k–$100k
Płynność handlu
Jakość egzekucji
Koszt wejścia i głębokość na giełdę przy $1k–$100kBrak wystarczającej głębokości · 0 z 3 giełd udźwignie $10k
Za mała głębokość: MEXC
Brak świeżych danych arkusza: Gate.io, Extended
Szacunek egzekucji taker z przybl. opłatami - realizacja maker nie jest gwarantowana.
Najlepsze giełdy dla tego instrumentu bazowego
Najlepsza płynność
CEGNajwęższy spread
CEGNajwyższy wolumen
CEGHistoria finansowania
Zapisane migawki giełdowe według rynku
Historia finansowania
Zapisane migawki giełdowe według rynkuDane spółki
Fundamenty spółki
Zaktualizowano 6h temu
Dane spółki
Fundamenty spółki
Więcej wskaźników
Szczegóły fundamentów
Roczne + kwartalneOdświeżono 6h temu
Wykresy: przychody, zysk, przepływy pieniężne i wycena
Następny katalizator
Katalizatory
Następny katalizator
Katalizatory
Brak nietypowej aktywności perp.
Dane research
Analitycy, raporty i porównanie peerów
Dane research
Analitycy, raporty i porównanie peerów
Prognozy
6Wydarzenia spółki
6Porównanie ze spółkami podobnymi
Podobne notowane perpetualsStruktura przychodów
OczekujeAnalitycy
OczekujeWłasność
CEG-PERPZgłoszenia
OczekujeTranskrypcje
OczekujeWiadomości o spółce
Najpierw Reuters, WSJ, Bloomberg i FT, o ile dostarcza je nasz dostawca wiadomości; inni wydawcy za drugim filtrem. Nagłówki prowadzą do wydawcy.Brak artykułów Reuters, WSJ, Bloomberg lub FT o tej spółce w naszym kanale.
Dane spółek FMP
Analiza spółki
Aktualizacja: 5 paź 2026, 23:26 UTC
Dane spółek FMP
Analiza spółki
Profil spółki
- Sektor
- Utilities
- Branża
- Independent Power Producers
- Prezes
- Joseph Dominguez
- Pracownicy
- 15 315
- Data IPO
- 19 sty 2022
- Kraj
- US
- Giełda
- NASDAQ Global Select
Czynniki ratingu
- Zwrot z kapitałui
- 3
- Zwrot z aktywówi
- 5
- Dług do kapitałui
- 2
- Cena do zyskui
- 2
- Cena do wartości księgoweji
- 2
Komunikaty spółki
Ujawnienia Kongresu
Senat
Izba Reprezentantów
Historia kapitalizacji
Najwięksi posiadacze wśród funduszy
| Fundusz | Waga | Posiadane akcje |
|---|---|---|
| VTI | 0,12% | 10,3 mln |
| VOO | 0,13% | 8,5 mln |
| QQQ | 0,38% | 7,4 mln |
| VO | 0,85% | 7 mln |
| XLU | 6,83% | 5,9 mln |
| IVV | 0,13% | 4,4 mln |
| FXAIX | 0,13% | 4,1 mln |
| 1557.T | 0,13% | 4,1 mln |
| SPY | 0,13% | 4 mln |
| VTV | 0,32% | 3,1 mln |
| S5SD.L | 0,21% | 2,7 mln |
| VOT | 2% | 2,5 mln |
Historia trafności analityków
Jak radzą sobie analitycy pokrywający CEG: rekomendacje, trafność cen docelowych i zmierzona reakcja po ich wezwaniach.
| 12 miesięcy | 3 lata | |
|---|---|---|
| Rekomendacje | 104 | 274 |
| Analitycy | 25 | 31 |
| Kupuj / trzymaj / sprzedaj | 91 / 13 / 0 | 206 / 68 / 0 |
| Podwyższenia / obniżenia / rozpoczęcia | 2 / 0 / 5 | 4 / 4 / 13 |
| Ceny docelowe osiągnięte / nieosiągnięte | 0 / 99 (0%) | 71 / 187 (28%) |
| Śr. zwrot po rekomendacji (TipRanks) | -31,3% | -7,6% |
| Najlepsza / najgorsza rekomendacja | -10,7% / -50,2% | +146,6% / -50,2% |
Po rekomendacjach kupna na tej spółce: medianowy ruch po 21 dniach +2,4% wobec S&P 500 -0,3% (n = 205)
Najtrafniejsi na tej spółce
Udział cen docelowych analityka dla tej spółki, które kurs osiągnął w ciągu 12 miesięcy (nasz pomiar z ostatnich 3 lat, co najmniej 8 celów). Opisuje przeszłe rekomendacje, nie szanse obecnej.
- David ArcaroMorgan Stanley100% trafności na tej spółce · 22 celów zmierzonychKupujcel 369 USD21 wrz 2026
- Ross FowlerBank of America Securities100% trafności na tej spółce · 14 celów zmierzonychKupujcel 361 USD15 lip 2026
- James ThalackerBMO Capital100% trafności na tej spółce · 13 celów zmierzonychKupujcel 350 USD1 paź 2026
Najnowsze rekomendacje
| Data | Analityk | Rekomendacja | Cel | |
|---|---|---|---|---|
| 1 paź 2026 | James ThalackerBMO Capital | KupujPotwierdzono | 350 USD | artykuł ↗ |
| 1 paź 2026 | Rinny SinghBank of America Securities | KupujUtrzymano | – | artykuł ↗ |
| 30 wrz 2026 | Carly DavenportGoldman Sachs | TrzymajUtrzymano | 305 USD | artykuł ↗ |
| 1 paź 2026 | Nicholas AmicucciEvercore ISI | KupujUtrzymano | 380 USD | artykuł ↗ |
| 1 paź 2026 | Rinny SinghBank of America Securities | KupujUtrzymano | – |
Udział analityków na rekomendację w każdym miesiącu (ostatnia rekomendacja analityka w ciągu 180 dni). Cele i zamknięcia w USD.
Dane TipRanks przez FMP · obliczono 2 paź 2026 · 104 rekomendacji
Najczęstsze pytania
Gdzie mogę handlować kontraktami perpetual CEG?
Kontrakty perpetual Constellation Energy Corporation (CEG) są notowane na 3 giełdach krypto, w tym MEXC, Gate.io, Extended. PerpEquities porównuje je według ceny na żywo, stawki finansowania, otwartego zainteresowania i płynności.
Czy mogę handlować CEG przez całą dobę?
Tak. W przeciwieństwie do bazowej akcji, perpetuale CEG są notowane 24/7 — również w weekendy i poza standardowymi godzinami sesji.
Jaka jest stawka finansowania perpetualów CEG?
Obecnie stawka fundingu perpa CEG wynosi +4,4% w skali roku (mediana giełd), w przedziale od 0,0% do +21,9% na 3 giełdach. Dodatnia stawka oznacza, że longi płacą shortom. PerpEquities pokazuje bieżącą stawkę i historię dla każdej giełdy.
Jak cena perpa CEG ma się do akcji Constellation Energy Corporation?
Medianowa cena mark perpa CEG to 268,8 $ wobec referencyjnej ceny akcji 268,8 $, czyli baza 0,0%. Perpy podążają za akcją przez cenę indeksową; różnica rośnie, gdy funding lub płynność rozjeżdżają się między giełdami.
Czym jest kontrakt perpetual CEG?
Perpetual CEG to instrument pochodny śledzący cenę Constellation Energy Corporation bez daty wygaśnięcia. Pozwala zajmować pozycje długie i krótkie na Constellation Energy Corporation na giełdach krypto przez całą dobę.
Czym jest perpetual CEGUSDT?
CEGUSDT to symbol, pod którym większość giełd krypto notuje perpetual Constellation Energy Corporation rozliczany w USDT (Tether). Śledzi kurs akcji CEG przez indeks, handluje się nim 24/7 z dźwignią i nigdy nie wygasa.
Osadź ten instrument

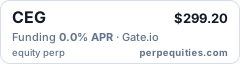
<a href="https://perpequities.com/pl/stocks/ceg-perp"><img src="https://perpequities.com/badge/ceg-perp.svg" width="240" height="64" alt="CEG perpetuals · perpequities.com" loading="lazy"></a>