Marché de référence
Fermé- Horaires réguliers
- 09:30 AM – 04:00 PM
- Prochain jour férié
- 26 nov. 2026 · Thanksgiving Day
 PerpEquities
Action
Futures perpétuels GME sur 17 plateformes crypto – prix du perp vs l'action, taux de funding, open interest et où trader GMEUSDT.
GameStop Corp. est un détaillant spécialisé dans les produits de jeu et de divertissement, notamment les consoles neuves et d'occasion, les jeux, les accessoires et le contenu numérique, opérant en ligne et en magasin aux États-Unis, au Canada, en Australie et en Europe.
Utilisez les flèches gauche et droite pour examiner les points du graphique.
Données de trading
Certains liens vers des plateformes sont sponsorisés. Nous pouvons percevoir une commission et les utilisateurs éligibles peuvent parfois bénéficier de réductions sur les frais de trading, sans coût supplémentaire.
| Trader | ||||||||||||
|---|---|---|---|---|---|---|---|---|---|---|---|---|
 Binance Binance | Trader | GME/USDT | En négociation | $25,08 | 0,0 % APR 0,000 % toutes les 8h | +4,0 bps | 306 k $ | 1,4 M $ | 1,2 M $ | USDT | - | |
 Hyperliquid HIP-3 Hyperliquid HIP-3 | Trader | xyz:GME | En négociation | $25,07 | -93,9 % APR -0,011 % toutes les 1h | +6,8 bps | 152,9 k $ | 930,7 k $ | 2,9 M $ | USDC | 10x | |
 Bitget Bitget | Trader | GME/USDT | En négociation | $25,10 | 0,0 % APR 0,000 % toutes les 8h | +8,0 bps | - | 152,4 k $ | 432 k $ | USDT | 20x | |
 MEXC MEXC | Trader | GME/USDT | En négociation | $25,10 | 0,0 % APR 0,000 % toutes les 8h | +4,0 bps | 388,2 k $ | 102,4 k $ | 422 k $ | USDT | 20x | |
 Helix (Injective) Helix (Injective) | Trader | GME/USDC | En négociation | $25,06 | +24,1 % APR +0,00275 % toutes les 1h | +107,3 bps | 1 k $ | 67,8 k $ | - | USDC | 6x | |
 OKX OKX | Trader | GME/USDT | En négociation | $25,06 | 0,0 % APR 0,000 % toutes les 8h | +12,0 bps | 33,3 k $ | 65,8 k $ | 336,9 k $ | USDT | 20x | |
 Bybit Bybit | Trader | GMESTOCK/USDT | En négociation | $25,15 | 0,0 % APR 0,000 % toutes les 8h | +27,8 bps | 4,1 k $ | 10,8 k $ | 407 k $ | USDT | 25x | |
 HTX HTX | Trader | GME/USDT | En négociation | $25,11 | 0,0 % APR 0,000 % toutes les 8h | +27,8 bps | 40,7 k $ | 4,7 k $ | 13,6 k $ | USDT | - | |
 Aster Aster | Trader | GMEUSDT | En négociation | $25,09 | 0,0 % APR 0,000 % toutes les 8h | +95,6 bps | 70,5 k $ | 2,9 k $ | 11,8 k $ | USDT | - | |
 Gate.io Gate.io | Trader | GME/USDT | En négociation | $25,09 | 0,0 % APR 0,000 % toutes les 8h | +22,7 bps | 15,6 k $ | 2,2 k $ | 544,3 k $ | USDT | 20x | |
 Crypto.com Exchange Crypto.com Exchange | Trader | GME/USD | En négociation | $25,44 | +45,8 % APR +0,00523 % toutes les 1h | +23,9 bps | 13,8 k $ | 68,7 $ | 3,1 k $ | USD | 50x | |
 gTrade (Gains) gTrade (Gains) | Trader | GME/USD | En négociation | $24,69 | - | - | - | - | - | USD | 2x | |
 BingX BingX | Trader | GME-USDT | En négociation | $25,09 | +5,5 % APR +0,00500 % toutes les 8h | +4,0 bps | 362,8 k $ | 6,6 M $⚠ | 237,4 k $ | USDT | - | |
 XT.com XT.com | Trader | GME/USDT | En négociation | $25,08 | +11,0 % APR +0,010 % toutes les 8h | +4,0 bps | 16,4 k $ | 3 M $⚠ | 274 k $ | USDT | 20x | |
 LBank LBank | Trader | GMESTOCK/USDT | En négociation | $25,08 | 0,0 % APR 0,000 % toutes les 8h | +4,0 bps | 301 k $ | 2,6 M $⚠ | 12,9 k $ | USDT | 20x | |
 Ourbit Ourbit | Trader | GME/USDT | En négociation | $25,08 | 0,0 % APR 0,000 % toutes les 8h | +8,0 bps | - | 1,3 M $⚠ | 179,1 k $ | USDT | 20x | |
 KuCoin KuCoin | Trader | GME/USDT | En négociation | $25,08 | 0,0 % APR 0,000 % toutes les 8h | +12,0 bps | 6,4 k $ | 1 M $⚠ | 172,3 k $ | USDT | 20x |
Volume non vérifié : disproportionné par rapport à l'intérêt ouvert, signe typique de wash trading. Ces plateformes sont listées en dernier.
Répliques tokenisées de l'action réelle, négociables on-chain et sur les plateformes crypto en continu. La prime/décote compare le prix du token à notre prix de référence de l'action. Données : CoinMarketCap · Robinhood · DexScreener · GeckoTerminal.
| Produit | Cours | Prime vs action | Vol. 24h | Cap. boursière | Chaînes |
|---|---|---|---|---|---|
| GMEBbStocks | $25,07 | -0,10 % | $1.9M | $6.9M | BNB Smart Chain (BEP20) |
| GMEonOndo GM | $25,47 | +1,49 % | $839k | $426k | Ethereum · BNB Smart Chain (BEP20) · Solana |
| GMERobinhood | $25,08 | -0,10 % | $533k | $3.2M | Robinhood Chain |
| GMEXxStocks | $25,23 | +0,51 % | $451k | $2.0M | Solana · Arbitrum · BNB Smart Chain (BEP20) · TON |
| WGMEXxStocks | $25,39 | +1,16 % | – | $216k | X Layer · Arbitrum |
| Plateforme | Paire | Cours | Vol. 24h | Liquidité |
|---|---|---|---|---|
 pancakeswapDEX · bsc pancakeswapDEX · bsc | GMEB/USDT ↗ | $25,15 | $674k | $212k |
 uniswapDEX · robinhood uniswapDEX · robinhood | GME/USDG ↗ | $25,08 | $533k | $221k |
| pancakeswapDEX · bsc | GMEon/USDT ↗ | – | – | – |
Négociabilité
Liquidité large · 9 des 17 plateformes absorbent $10k · Coût typique: +10,1 bps – +45,1 bps
Trop mince: Gate.io, Crypto.com Exchange, KuCoin, Bybit
Pas de carnet récent: Helix (Injective), Ourbit, Bitget, gTrade (Gains)
Estimation d'exécution taker avec frais approx. - les fills maker ne sont pas garantis.
Données de l'entreprise
Actualisé il y a 33m
Prochain catalyseur
Aucune activité perp inhabituelle actuellement.
Données de référence FMP
Données de recherche
Aucun article de Reuters, WSJ, Bloomberg ou FT sur cette entreprise dans notre flux.
Données d’entreprise FMP
| Fonds | Poids | Actions détenues |
|---|---|---|
| IJH | 0,25% | 14,4 M |
| XAW.TO | 0,01% | 14,4 M |
| NJH | 0,28% | 13,9 M |
| VTI | 0,01% | 12,8 M |
| VB | 0,09% | 9,3 M |
| VBR | 0,16% | 5,9 M |
| VXF | 0,09% | 4,8 M |
| MDY | 0,26% | 3,1 M |
| SPMD | 0,26% | 2,2 M |
| IJJ | 0,52% | 2,1 M |
| NJJ | 0,58% | 2,1 M |
| FSMAX | 0,11% | 2 M |
Les résultats des analystes qui suivent GME : recommandations, précision des objectifs de cours et réaction mesurée après leurs appels.
| 12 mois | 3 ans | |
|---|---|---|
| Recommandations | 0 | 21 |
| Analystes | 0 | 3 |
| Acheter / conserver / vendre | – | 0 / 1 / 20 |
| Relèvements / abaissements / initiations | 0 / 0 / 0 | 0 / 0 / 1 |
| Objectifs atteints / manqués | – | 20 / 0 (100 %) |
| Rendement moyen après recommandation (TipRanks) | – | +164,8 % |
| Meilleur / pire appel | – / – | +330,5 % / +60,7 % |
Après les appels à l'achat sur cette action : pas encore assez de cas mesurés
| Date | Analyste | Appel | Objectif | |
|---|---|---|---|---|
| 2 juil. 2025 | Alicia ReeseWedbush | VendreInitiation | 13,50 $US | article ↗ |
| 11 juin 2025 | Michael PachterWedbush | VendreRéitérée | 13,50 $US | article ↗ |
| 5 juin 2025 | Michael PachterWedbush | VendreRéitérée | 13,50 $US | article ↗ |
| 31 mars 2025 | Michael PachterWedbush | VendreMaintenue | 13,50 $US | article ↗ |
| 27 mars 2025 | Michael PachterWedbush | VendreMaintenue | 11,50 $US | article ↗ |
Part des analystes par recommandation chaque mois (dernier appel de chaque analyste sur 180 jours). Objectifs et clôtures en USD.
Données TipRanks via FMP · calculé le 2 oct. 2026 · 0 recommandations
Les contrats perpétuels GameStop Corp. (GME) se négocient sur 17 plateformes crypto, dont BingX, XT.com, LBank. PerpEquities les compare selon le prix en direct, le taux de financement, l'open interest et la liquidité.
Oui. Contrairement à l'action sous-jacente, les perpétuels GME se négocient 24h/24 et 7j/7 — y compris le week-end et en dehors des heures de marché habituelles.
En ce moment, le taux de funding du perp GME est de 0,0 % annualisé (médiane des plateformes), entre 0,0 % et 0,0 % sur 17 plateformes. Un taux positif signifie que les longs paient les shorts. PerpEquities affiche le taux en direct et son historique par plateforme.
Le prix mark médian du perp GME est de 25,1 $ contre un prix de référence de l'action de 25,1 $, soit une base de -0,1 %. Les perps suivent l'action via un prix d'indice ; l'écart se creuse quand le funding ou la liquidité divergent entre plateformes.
Un perpétuel GME est un produit dérivé qui suit le cours de GameStop Corp. sans date d'échéance. Il permet de prendre des positions longues ou courtes sur GameStop Corp. sur les plateformes crypto, à toute heure.
GMEUSDT est le symbole utilisé par la plupart des plateformes crypto pour le perpétuel GameStop Corp. réglé en USDT (Tether). Il suit le cours de l'action GME via un indice, se négocie 24h/24 avec effet de levier et n'expire jamais.
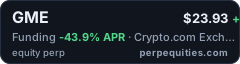
<a href="https://perpequities.com/fr/stocks/gme-perp"><img src="https://perpequities.com/badge/gme-perp.svg" width="240" height="64" alt="GME perpetuals · perpequities.com" loading="lazy"></a>